Insights / Articles
How to Find a Private Company's Revenue (and How Reliable Each Method Is)
Stripe's $1.4 trillion headline was payment volume, not revenue. Four ways to find a company's revenue, from filings to estimates.

- Filed accounts offer strong evidence, but revenue isn’t always publicly available.
- A company’s revenue run rate isn’t the same as its annual revenue.
- At scale, keep reported figures and estimates clearly labeled, with their sources and dates.
Private-company revenue can be hard to find because many businesses aren’t required to publish it.
You can look in official filings, check what the company discloses itself, or estimate it, but these sources aren't equally reliable.
Providers like Veridion supply revenue at scale and label each figure as reported or estimated.
Here’s how to find a company’s revenue and assess how much you can rely on it.
1. Check Official Registry Filings First
Start with filed annual accounts. When they include revenue, they give you a figure tied to a defined reporting period and legal entity. That makes this your most trustworthy source.
These accounts follow statutory reporting requirements and may include an independent audit. But don’t assume every filing is audited: smaller companies can qualify for exemptions, as shown below:

Source: Gov.uk
Where should you look?
Country | Where to check | Main limitation |
|---|---|---|
UK | Companies House filing history | Small companies can omit the profit-and-loss account; micro-entities can file only a simplified balance sheet. |
France | DATA INPI’s company database and filed annual accounts | Confidentiality provisions can restrict access. SIRENE supplies identification data, rather than revenue figures. |
US | Relevant regulatory filings, where available | Private companies generally don’t publish financial statements through a universal public filing requirement. |
Take note of these differences if you’re building a dataset across jurisdictions. A successful registry lookup may establish that a business exists without revealing its sales.
Open the latest accounts and find the turnover or revenue line. Record the:
- Fiscal year end
- Currency
- Units
- Whether the accounts cover one entity or a consolidated group
Then check the reporting period against your intended use. Annual reporting and filing delays mean the latest available figure could potentially describe activity from one to two years ago.
For larger lists, Bureau van Dijk’s Orbis, now part of Moody’s, and D&B aggregate company financial information from multiple sources, including registries. This reduces country-by-country searching, with an important caveat: missing disclosures remain missing.
Reliability: high when revenue is disclosed. Coverage gaps and reporting delays are the main limits.
So if the company’s accounts don’t reveal turnover, check what they chose to share elsewhere.
2. Look for Figures the Company Discloses Itself
Private companies sometimes publish revenue voluntarily, even when their filed accounts don’t show it. These disclosures can fill the gaps, provided you check exactly what the number describes.
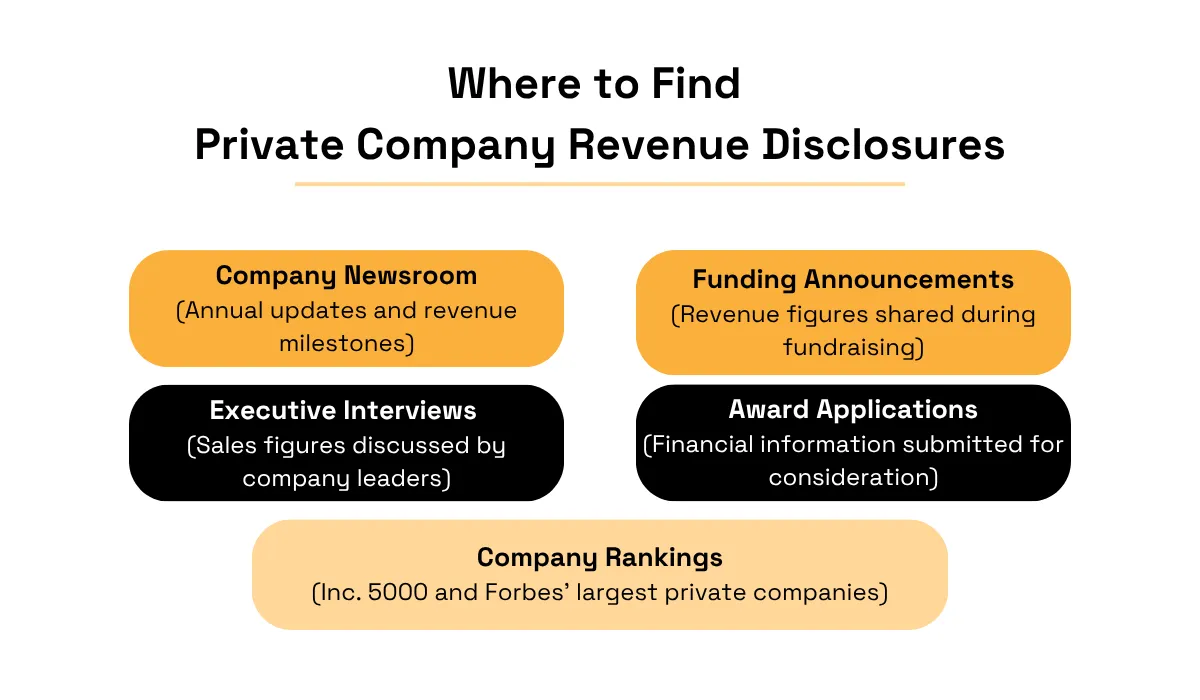
When filed accounts don’t reveal revenue, check these five places for figures the company may have shared:
Source: Veridion
But check the ranking’s methodology.
As Inc. Magazine explains, Inc. 5000 applicants must verify their revenue with signed financial documents. But the list itself publishes growth rates, not revenue, so you'll usually see a figure only if Inc. writes an article about the company.
And Forbes lists can contain estimates, so a ranking entry isn’t automatically an official company-reported figure.
Company announcements need similar scrutiny, because the headline number isn't always revenue.
Take Stripe’s 2024 annual update.
-1200x748.webp?2026-11-05T08%3A16%3A31.044Z)
Source: Stripe
The company announced $1.4 trillion in total payment volume. That measures payments processed through Stripe, rather than Stripe’s own revenue. If you entered that into a company-revenue field, it would create a major error.
Run rates are another trap. If a company annualizes one month's sales, one month’s sales, the result assumes that pace continues for a year. It doesn’t tell you what the business actually earned over the preceding twelve months.
Before accepting a disclosed figure, make sure you record:
- The original source and publication date
- The exact wording used
- The reporting period and currency
- Whether it covers the whole company or one business unit
Reliability: medium overall. Evidence is stronger where supporting documents exist. Figures could be rounded, selectively presented, or just hard to compare.
Plus, manual searching becomes pretty expensive across thousands of companies. Where disclosures stop, you’ll need estimates, and a clear record of their assumptions.
3. Estimate Revenue From Proxies
When you can’t find a disclosed figure, operational data can help you estimate a private company's revenue. The aim here is to establish a plausible range, with assumptions you can explain.
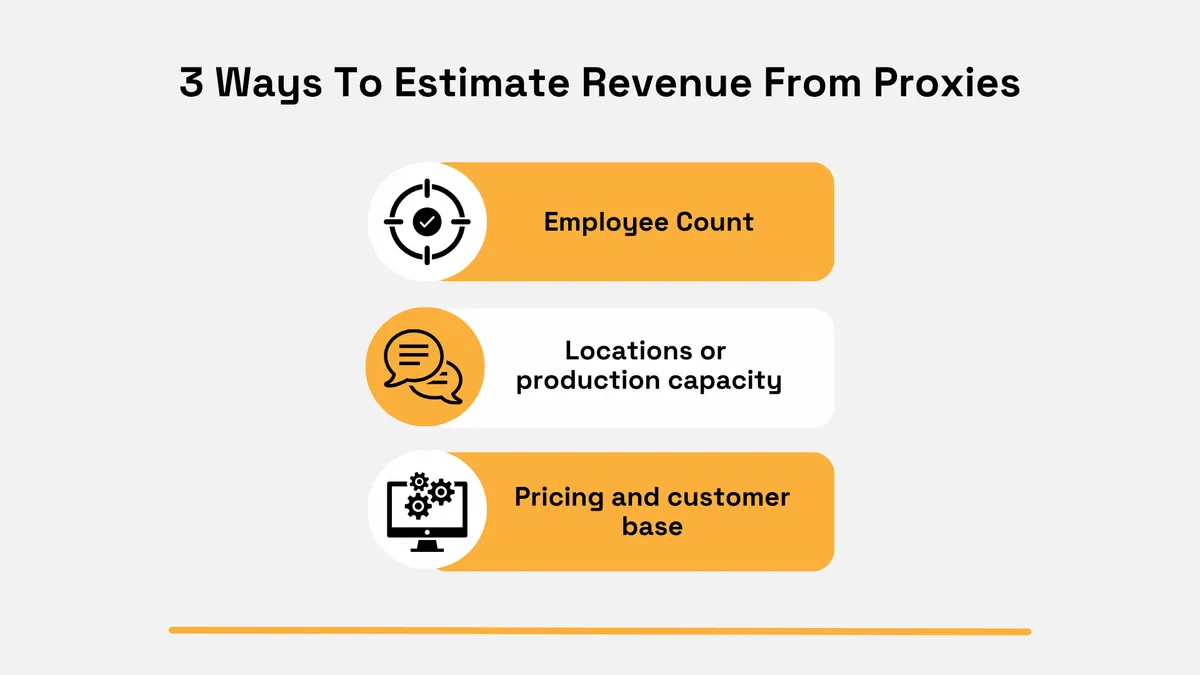
Here are the three most common approaches:
Source: Veridion
Here’s what those approaches mean in practice, and what can distort their results:
Proxy | How to estimate revenue | What can distort the result |
|---|---|---|
Employee count | Multiply headcount by a revenue-per-employee benchmark for comparable businesses. | Outsourcing, automation, and different business models can change productivity substantially. |
Locations or production capacity | Multiply locations by comparable annual sales per site, or estimated output sold by average selling price. | Sites vary in size and activity; production capacity doesn’t tell you actual utilization or sales. |
Pricing and customer base | Multiply estimated paying customers by average annual spending. | Discounts, churn, free accounts, and different pricing tiers affect realized revenue. |
Choose benchmarks that match the company’s industry, geography, and size.
For example, the U.S. Economic Census publishes industry-level revenue and employment data that you can use to derive revenue-per-employee ratios.
What does that look like in practice?
Say a private IT services company has around 80 employees. For this illustrative calculation, assume comparable businesses generate $150,000-$250,000 in annual revenue per employee.
Your estimate becomes:
- Lower bound: 80 × $150,000 = $12 million.
- Upper bound: 80 × $250,000 = $20 million.
Record $12-$20 million, alongside the benchmark source and headcount date.
Bottom line: this is an assumption-based range, not a statistical confidence interval.
Reliability: low to medium. Estimates can be way off when a company works differently from others in its industry. A software company, for example, might earn a lot from subscriptions with only a small team.
On top of that, doing this for thousands of companies and keeping all those employee details up to date takes a lot of work. Structured company data can make that easier.
4. Use Structured Company Data at Scale
For a whole account list or portfolio, you need revenue data you can ingest repeatedly without researching every company by hand.
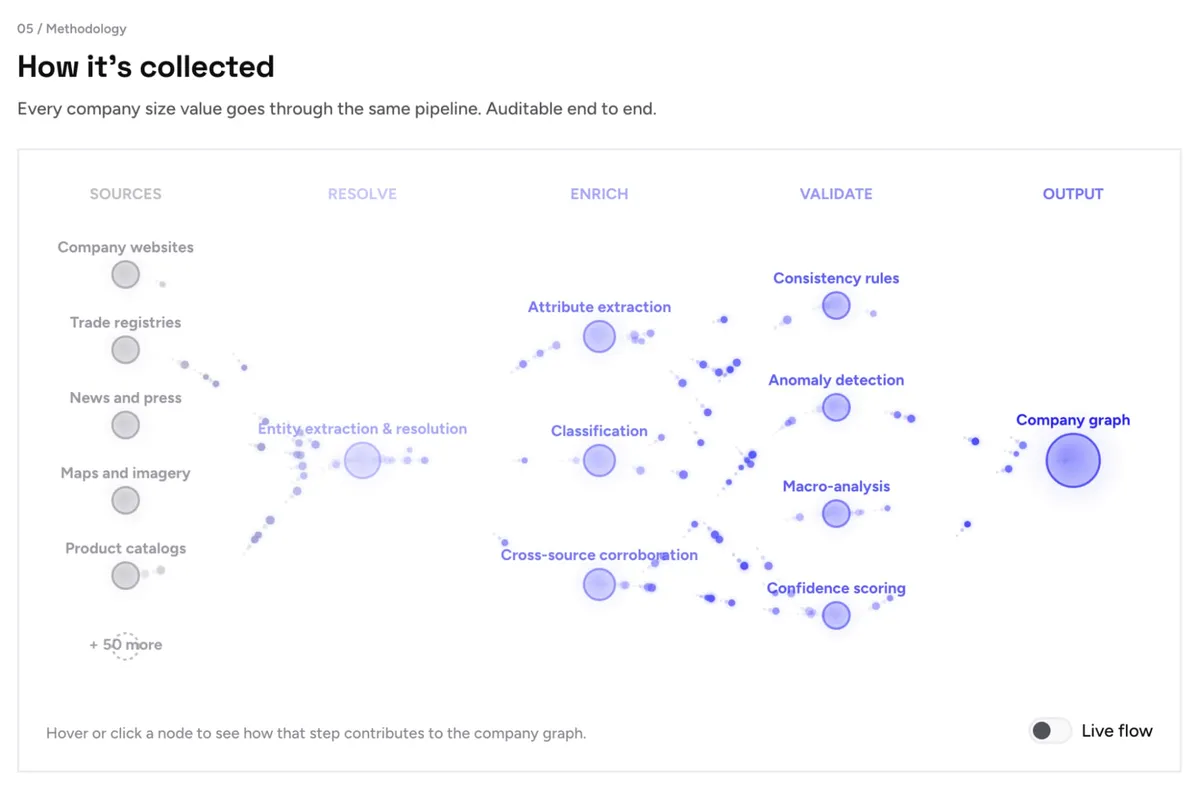
Here’s how Veridion’s revenue attribute can help you.
Source: Veridion
Our platform brings data from multiple sources together and resolves it to the right company. Then, it enriches and validates the resulting profile. Revenue is one of 465 attributes available to help you understand each business.
Where a company publishes revenue, Veridion extracts the disclosed figure. Where it doesn’t, Veridion supplies an estimate generated by proprietary machine-learning models.
And each figure comes with a confidence score, a source URL, and a last-verified date, so you know how much to trust it right away (or if it needs another check).
The revenue attribute is refreshed weekly. But keep in mind that a recent refresh doesn’t necessarily mean the underlying financial period is recent.
Your team can enrich existing company records through Match & Enrich, ingest batch deliveries in CSV, JSON, or Parquet, or receive the data directly in Snowflake, BigQuery, or Databricks. You can get data on a regular schedule and update only the records that changed.
In your pipeline:
- Match provider records to your internal company IDs.
- Keep the reported-or-estimated label with each figure.
- Apply a confidence threshold validated against your own sample.
- Route lower-confidence or stale records for review.
A global management consultancy's customer story shows this approach in practice.
Source: Veridion
The consultancy was working for a client in the payments industry and needed data on Mexican merchants across eight categories, including restaurants, hotels, airlines, and ecommerce platforms.
For each category, the project required merchant counts, locations, and revenue over the previous 12 months, split into domestic and cross-border sales, and card-present and card-not-present payments.
No ready-made market report covered that scope.
The data also had to arrive within the project's timeline, which in consulting often means weeks rather than months. So the consultancy defined the exact slice it needed, and Veridion built a dataset to that specification from its company data.
The firm has used the same approach on other projects, from HVAC operators in Georgia and Alabama to architecture services in Germany, each delivered as a separate dataset.
Reliability: depends on the underlying figure. Structured delivery makes revenue usable at scale. But provenance, confidence, and reporting dates determine how you should use each value.
Those details always need to travel with the number.
5. Cross-Check and Label Every Figure
Before accepting revenue into your dataset, compare at least two methods if you can. Even a strong source can describe the wrong entity, or a metric that only resembles annual sales.
Two matching numbers don’t necessarily provide independent confirmation, either. You can have something like a provider and a news article repeating the data from the same company announcement.
So always trace each figure back to its original source.
Say filed accounts show $12 million, and a headcount-based estimate suggests $25 million. Check if the estimate uses group-wide employees, a newer observation date, or a benchmark from a different industry. Only then decide which figure fits your use case.
However, a large gap should trigger investigation.
Store the evidence in separate fields:
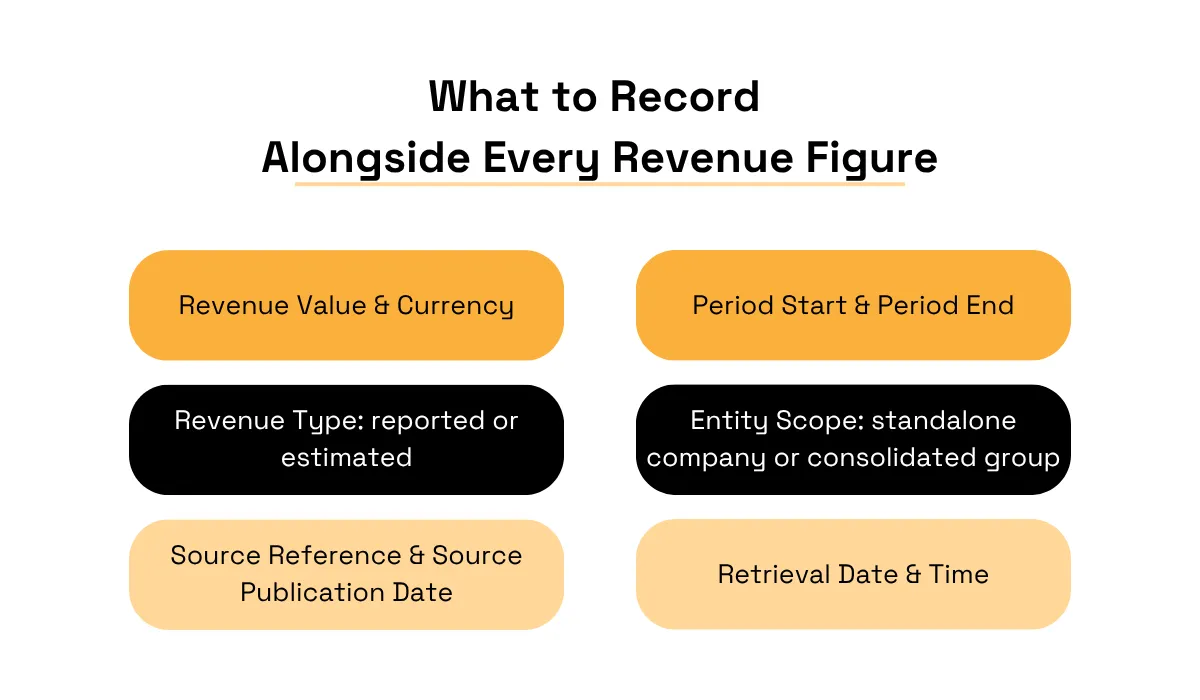
Source: Veridion
And keep source dates, reporting periods, and retrieval dates separate. Just because you downloaded an old statement today doesn’t make its revenue current.
The methods compare as follows:
Method | Reliability | Coverage | Freshness | Effort per company |
|---|---|---|---|---|
Official registry filings | High when revenue is disclosed | Depends on jurisdiction, company size, and filing exemptions | Annual; reporting and filing delays apply | Medium to high manually |
Company disclosures | Medium; stronger with supporting evidence | Limited to businesses that disclose useful figures | Irregular; check the stated period | Medium to high |
Proxy estimates | Low to medium | Possible where suitable inputs and benchmarks exist | Depends on input dates | High for a defensible manual estimate |
Structured company data | Varies between reported and modeled values | Provider- and attribute-dependent | Provider-specific; financial periods may still lag | Low after integration |
With these details included, anyone using the data can see which figures they can rely on and which they should send to another check.
How Does Veridion Compare to Other Company Data Providers?
Compare providers on the revenue fields your pipeline needs (not their total company counts). A searchable company profile doesn’t guarantee you an available revenue figure or enough metadata to assess it.
The table below separates documented capabilities from details you should confirm in a sample export. “Not specified” means the reviewed public documentation doesn’t establish the detail, rather than that the capability is absent.
Provider | Where revenue figures come from | Are estimates labeled? | Private- and small-company coverage | Update frequency | Delivery options |
|---|---|---|---|---|---|
Figures extracted where a company publishes revenue; proprietary ML estimates where it doesn't | Distinguishes extracted from modeled revenue; every value has a confidence score, source URL, and last-verified date | Global company dataset covering 744.5M companies; validate revenue availability across your target small businesses | Revenue attribute refreshed weekly; underlying reporting periods can be older | API, batch files (CSV, JSON, Parquet), and warehouse delivery (Snowflake, BigQuery, Databricks); interactive API playground | |
Registry information, company-supplied or third-party financial figures, and D&B models | Some financial fields carry an actual-or-estimated indicator, but not for every country; confirm it in your chosen product | Includes private and small-business records; financial availability depends on country and source | Source- and country-dependent; check financial-field refresh separately | UI, API, and batch, depending on product | |
Revenue is available through company enrichment; the reviewed documentation doesn’t specify the filing-versus-modeling methodology | A reported-versus-estimated revenue flag isn’t specified in the reviewed documentation | Private-company filtering is supported; small-company revenue completeness isn’t specified | Revenue-specific refresh cadence isn’t specified | UI and API, including batch company enrichment | |
Bureau van Dijk (Orbis), now Moody’s | Standardized company financials assembled from multiple sources, alongside estimates and modeled projections | Actual financials and estimates are separately searchable; confirm revenue-level labels in the export schema | Focuses extensively on private companies; financial depth varies with filing obligations | No single revenue-specific cadence specified on the reviewed product page | Web UI, API, and bulk feeds |
Official registry records; revenue may not be available at all | Its documented core offering isn’t a modeled-revenue service | Covers registered private and small companies in supported jurisdictions; registration coverage doesn’t establish revenue coverage | Depends on registry availability and ingestion; no universal revenue cadence | Website UI, API, and bulk datasets |
Filings-oriented services fit workflows that need historical financial statements. Providers who combine disclosed and modeled revenue can support segmentation if disclosures are sparse.
ZoomInfo fits company enrichment within sales workflows if its revenue metadata meets your needs.
OpenCorporates supports registry-based identity checks and source discovery.
And for enterprise revenue pipelines, test Veridion and other candidates against the same account sample. Check where each figure comes from, how many companies have no revenue value, and how old the figures are before integrating.
Conclusion
Start with registry filings where revenue is available. For all other sources, see if you have a company-reported figure or an estimate, and keep its source, date, and reporting period next to it.
Structured data providers like Veridion make this process manageable at scale.
So take 10 companies from your list and check which have filed accounts with revenue.
Then, compare those figures with Veridion's data for the same companies and periods, and investigate the gaps before relying on estimates across your full dataset.
Articles
Discuss how these trends affect your organization.
Our analysts are available for a short call. Bring a specific question and we will ground it in the data.
Insights
Keep reading
More analysis, research, and outcomes grounded in live company intelligence.
How to Build a Strong Market Intelligence Strategy
Learn how to build a strong market intelligence strategy that helps you track trends, understand competitors, and make smarter decisions.
How Is AI Revolutionizing Market Intelligence?
Explore the key ways AI is transforming market intelligence workflows and helping businesses stay ahead of the competition.
6 Most Important Market Intelligence Metrics
Discover six must-track market intelligence metrics that can sharpen your competitive edge and support data-driven growth.