Insights / Articles
Industry Code Mapping: How to Reconcile NAICS, SIC, NACE, and Internal Taxonomies
Industry code mapping reconciles NAICS, SIC, NACE and internal taxonomies through a master standard, validated crosswalks and one company identity.

- Different industry codes for the same company across systems can break cross-system reporting.
- Reliable mapping needs a master taxonomy, validated crosswalks, and one confirmed company identity.
- NACE and NAICS have no direct crosswalk, so mapping must go through ISIC.
You’re looking up a company, but it appears as a software firm in one system and a business-services company in another. When industry classifications don’t align, neither do the reports.
Industry codes exist so companies can be grouped and counted as an industry. Different systems put the same company into different groups.
Industry code mapping is the work of making those systems agree on one classification per company. Without it, market sizes, risk scores, and supplier lists all drift.
The fix is to audit your systems, pick a master taxonomy, build validated crosswalks, and confirm each company's identity.
Why is Industry Code Mapping Needed?
An industry code is a short label recording what a company mainly does. Government agencies, exchanges, and data vendors attach one to a company record.
The point of the label is grouping. It lets you total spend across an industry, size a market, or pull every supplier in a category.
No single authority hands these codes out. In the United States, no central register holds the official classification. Separate agencies assign codes using their own methods.
So one company can hold several codes at once. Government forms carry NAICS, old filings carry SIC, and index providers add GICS. Each internal system then stores whichever code reached it first.
Industry code mapping is the work of connecting those codes to each other. It gives every system the same answer when you ask what industry a company is in.
The systems disagree because each draws its industry boundaries on a different principle. NAICS groups companies by what they make and how they make it, while GICS groups them by where their revenue comes from.
Classification system | Who assigns it and where it appears | What it is used for |
|---|---|---|
Agencies and data vendors maintain their own SIC lists; the code shows up on regulatory filings and in legacy databases | Reading older records and tracking an industry back through decades of filings | |
Selected by the business itself and applied by agencies such as the Census Bureau; appears on government forms and registrations | Current North American statistics, procurement, and regulatory reporting | |
Assigned by S&P Dow Jones Indices and MSCI to companies with listed equity; appears in market data feeds and index files | Grouping listed companies by their main revenue source for indexes and portfolios |
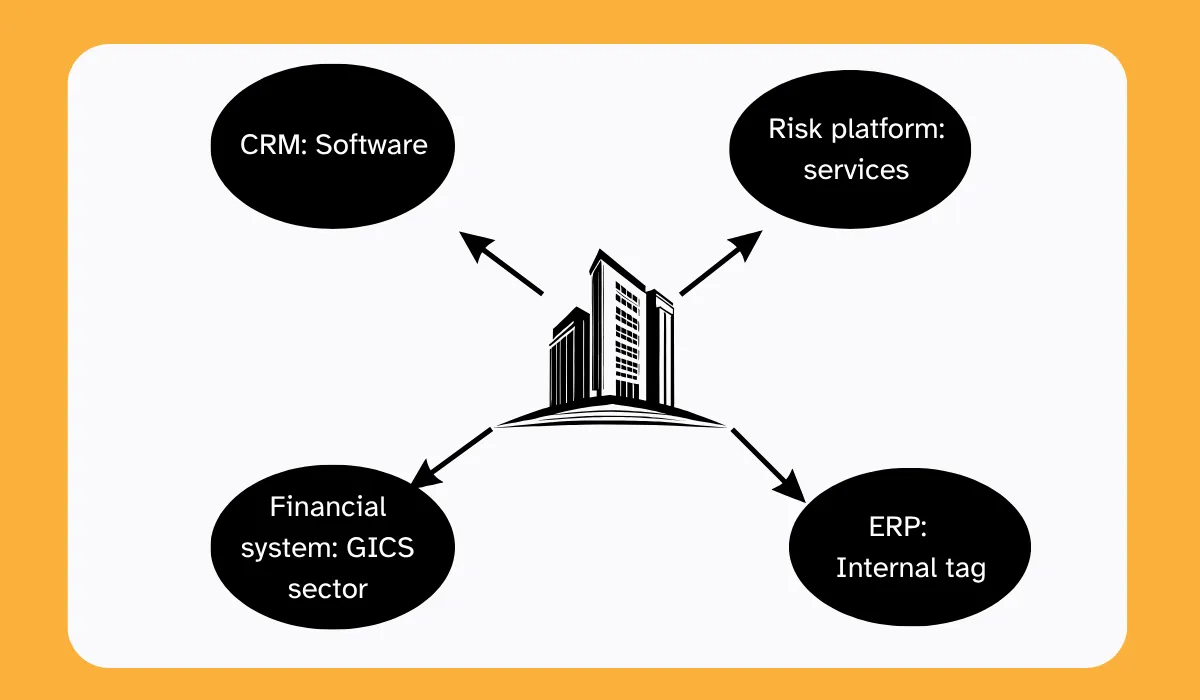
As a result, the same company can have one GICS label and a very different NAICS label.
Not every company carries all three. GICS is applied to companies with listed equity, while a private supplier may only ever have a self-selected NAICS code.
Source: Veridion
The clash shows up the instant you join two datasets. The same company reads as a software vendor in one system. The other system files it under professional services.
Neither record is wrong, but the two do not match.
Analysts then fix the differences by hand, which can lead to new errors. Over time, duplicate records increase, and market size estimates become less accurate.
Consider a simple market-sizing exercise across three systems.
The CRM classifies a company as “software”, while the risk platform classifies it as “services”. If you combine the data without matching the records first, the same company gets counted twice.
The total market then looks larger than it is.
The same problem affects risk scoring, supplier searches, and revenue reporting.
A supplier search based on one classification system can miss companies listed under another, causing companies to disappear from the results.
The hidden cost is the time analysts spend reconciling these differences.
They export the data, match codes by hand, and rebuild the connections every quarter. The same work comes up again with every reporting cycle.
The problem gets bigger as the company grows.
Every new tool, acquisition, or data source can add another classification system. Industry code mapping brings these systems together and gives every team one consistent view.
How Do You Build a Taxonomy Mapping Layer That Ensures Data Consistency?
A mapping layer is a set of rules that converts different classification systems into one standard. The process has four stages, with each stage building on the one before it.
The steps are simple: review your systems, pick a standard, map everything to it, and check that the matches are right.
1. Audit Every Classification System in Use
No registry holds one authoritative code per company, so each platform keeps its own copy. Each copy was entered at a different time by a different vendor, and they drift apart.
Start by finding every place a code is recorded. Check the CRM, enterprise resource planning (ERP) system, risk platform, spreadsheets, billing systems, compliance tools, and supplier portals.
For each system, note the taxonomy it uses and its version.
Source: Veridion
The version matters because classification systems change over time. For example, NAICS is updated every five years, so codes from different editions may not match.
Older systems may still use SIC, last revised in 1987, while newer systems use NAICS. Combine a supplier list from both, and the same company arrives twice under two unrelated codes. Spend by industry, supplier counts, and exposure reports all break at that point.
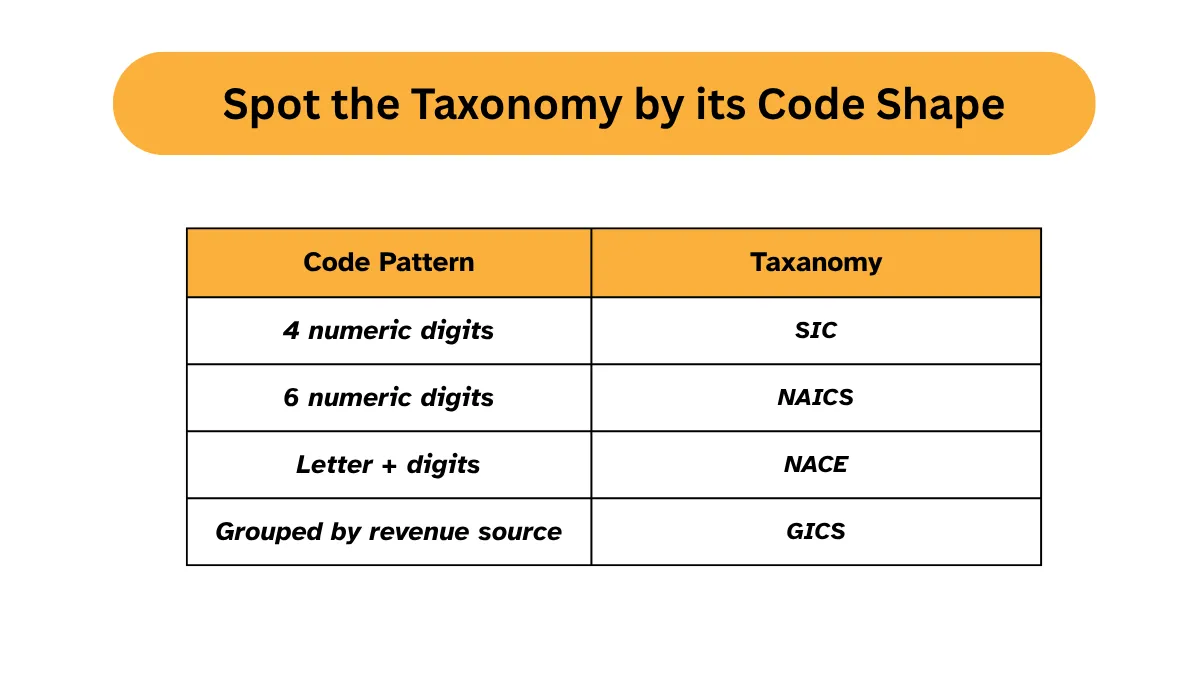
If the taxonomy is not documented, check a sample of codes. Four-digit numeric codes usually point to SIC, while six-digit codes point to NAICS.
Letter-and-number codes may indicate NACE or a national version of it.
Make sure to record the version for each taxonomy. Two systems may both use NAICS but different editions, which can cause codes to change or move.
Finally, create a simple inventory showing each system, its taxonomy, its version, and the team that owns it. This becomes the reference point for the next steps.
2. Establish or Adopt a Master Taxonomy
A taxonomy is more than a list of codes. It is a hierarchy that rolls companies up into industries, and industries up into sectors.
The hierarchy is what lets you work above the level of a single company. You need it to calculate the total spend across an industry or compare a sector year over year. It also lets you measure exposure to one part of the economy.
You are not overriding the code that some agency gave a company. You are choosing which hierarchy your own reporting rolls up to, then translating every other system into it.
Every system needs one standard to map to. Pick a single reference taxonomy and use it as the common standard for all systems.
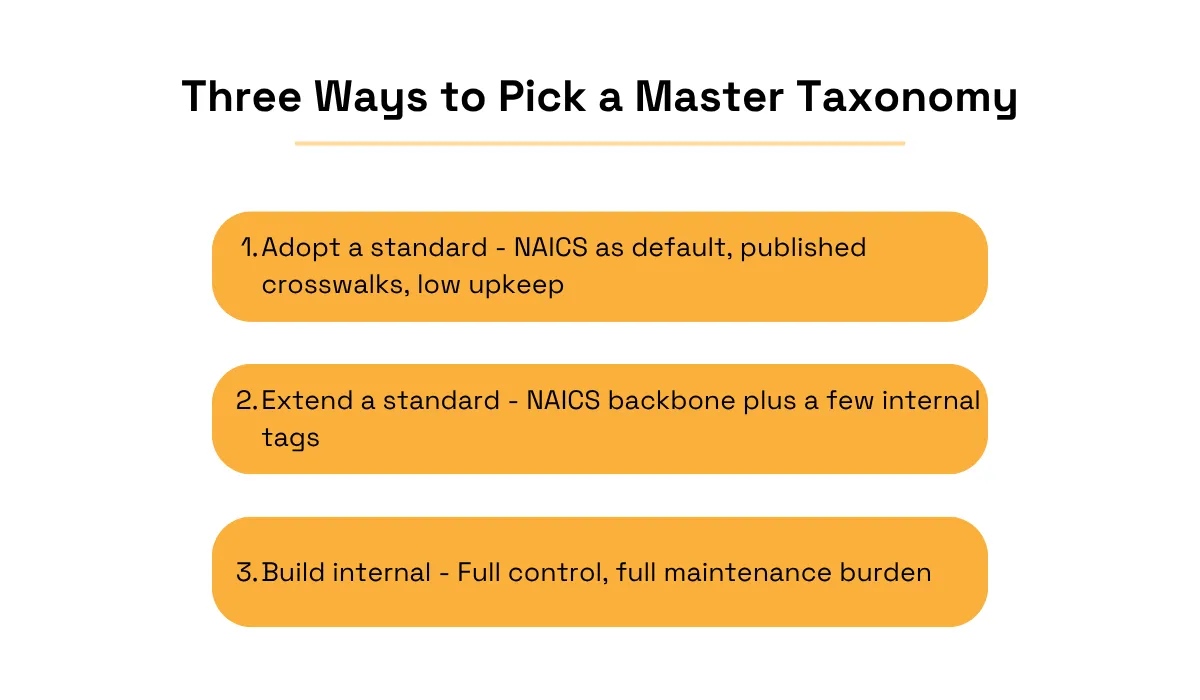
For most business data, NAICS is a strong choice.
It is updated regularly, and its six-digit codes provide enough detail to cover modern industries such as cloud computing and logistics.
Keep SIC when you need it for older records and regulatory filings. Your main taxonomy becomes the standard for current data, while SIC stays available for historical work.
Some teams build their own internal system instead of adopting a public standard. A custom scheme can fit unusual business areas, but your team then owns every update to it.
It also makes outside data harder to use. Most external files arrive in a public standard. You would then maintain a mapping from each one into your own scheme.
Most external data uses public standards, not your internal system. You then need to create and maintain mappings from each standard to your own system.
Consider this before building a custom system.
Public standards come with existing mappings, updates, and broad support. An internal system gives you more control, but it also means more work to maintain it.
A middle ground works well for many teams. Use NAICS as the main standard, then add a few internal tags for areas that need more detail.
Roll it out step by step: send new data to the main standard first, then update existing systems based on priority. This keeps daily reporting stable while the changes happen in the background.
Keep the decision and the reason behind it in the same register from the start.
This helps future teams understand why the standard was chosen, even after people or systems change.
Source: Veridion
3. Build Crosswalks Between Systems
Once the master taxonomy is set, the next step is to connect the systems. A crosswalk is a mapping table that links each classification system to the master standard.
Build the crosswalk as a table with one row per source code. Each row holds the source code, the master code it maps to, a weight for split matches, the evidence used, and the date.
Start from the official tables rather than a blank sheet. The Census Bureau publishes concordances, which are files stating how each code in one system corresponds to codes in another.
Load the relevant file, then cut it down to the source codes that appear in your own data. Most of the work disappears once you drop codes no company in your systems uses.
Read both definitions for every remaining pair before accepting it. Two codes with near-identical titles often cover different activities, and only the definition shows where they part.
These mappings are not always one-to-one. A code in one system may match several codes in another, and several source codes may map to one target code.
The old SIC code for "Eating Places" splits into two separate NAICS restaurant categories.
One covers full-service restaurants, while the other covers limited-service restaurants. A simple one-to-one match would miss this difference and could classify some incorrectly.
Systems also split activities at different depths. ISIC stops at four-digit classes, while NAICS divides the same activities further, down to six digits.
One ISIC class therefore covers work that NAICS separates into several distinct industries. You then decide which of those industries each company belongs in.
When one code can match several others, a weighted mapping table records how the records divide. Researchers bridging SIC and NAICS weight their crosswalks by employment, establishments, or payroll for the same reason.
Accuracy matters here because the totals feed decisions. A market size, an industry spend report, or a cap on exposure to one industry is only as sound as the counts beneath it.
Mapping across regions adds another challenge.
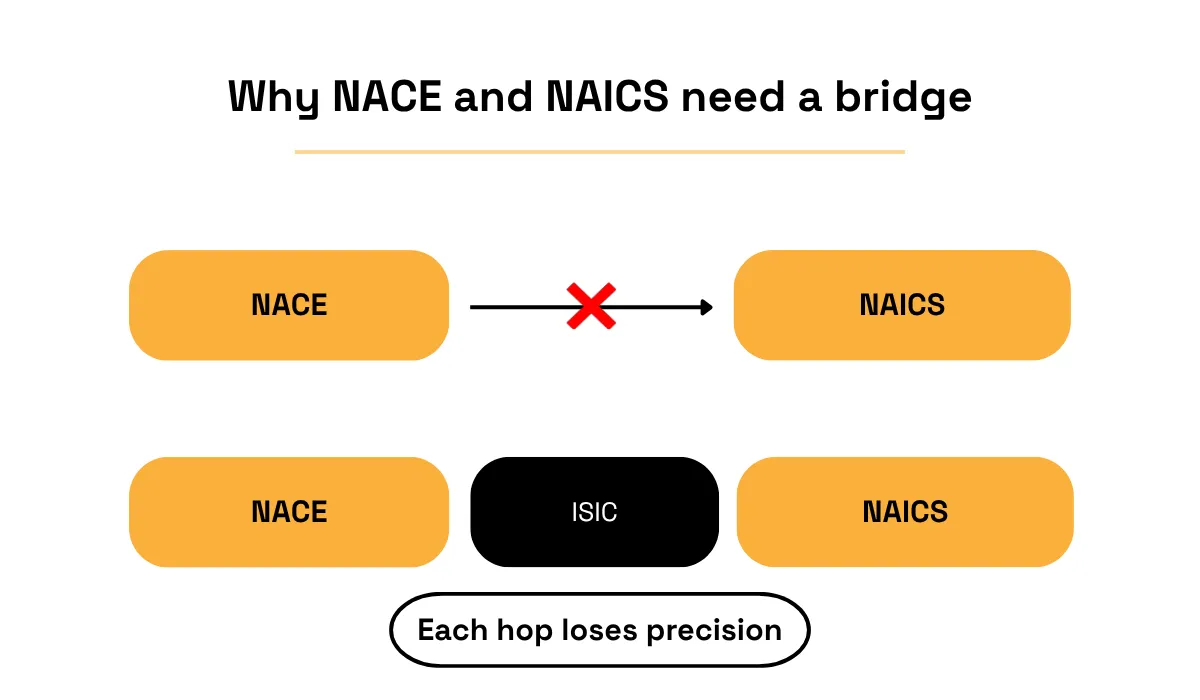
NACE and NAICS were never designed to line up. NACE is the European system built on ISIC, while NAICS was developed separately for North America.
No official body publishes a table between the two, so the mapping has to chain through ISIC. Each hop loses precision wherever one system splits an activity the other keeps whole.
Source: Veridion
Treat a published concordance as a starting point and not a finished mapping. Each row still needs checking against how your own data uses the code.
Validate the high-volume codes first, since they carry the most weight. A handful of common industries usually cover most of your records.
Keep the crosswalk in a shared location that every team can access. This way, everyone works from the same mapping instead of relying on an old copy saved elsewhere.
Review the crosswalk whenever the classification systems are updated. Changes to NAICS or NACE can affect existing mappings, so check them after each update.
Also record why each mapping was made. A short note on the reasoning behind a match makes later review far easier.
4. Use Entity Resolution to Keep Mapping Consistent
A crosswalk solves only part of the problem.
Even a good mapping will fail if the same company appears as two separate records. You first need to make sure each company has one clear identity.
For example, your CRM might list a supplier as "Acme Corp," while your risk system lists it as "Acme Corporation Ltd."
Both records may have the right classification, but the systems treat them as different companies.
The problem can start with something as simple as a legal suffix, a different name, or a subsidiary address. These small differences can make one company look like two.
Each record then gets its own codes. A crosswalk translates codes and cannot help here, because nothing in it says that two differently named rows describe one business.
Entity resolution is the process of deciding which records refer to the same real-world company. It applies wherever no shared identifier exists, which is the normal case across enterprise systems.
The process runs in three passes. The first matches records on hard identifiers such as a company registration number, a tax number, or a website domain.
The second pass handles records that share no identifier. Names, addresses, and other attributes are scored for similarity, and pairs above a threshold are treated as one company.
A full comparison of every record against every other is too slow at enterprise scale. Records are first sorted into blocks of plausible matches, and only pairs inside a block get compared.
The third pass groups confirmed pairs into one cluster per company and picks one winning value for each field. The resulting cluster is what carries the classification code
Skip this step, and duplicate company records can bring back the same mismatch the crosswalk was meant to fix.
Source: Veridion
The match also needs to work with messy data.
Company names can be misspelled, shortened, or written differently across countries. A good matching process looks past these differences and still identifies the right company.
Company structures can make this harder.
A parent company, subsidiary, and branch may each have different codes. You need to know which company the record refers to before assigning a code.
Veridion first confirms the company’s identity, then provides different classification formats for that same company. Its entity resolution service provides NAICS codes, activity tags, and product categories.
Each format is linked to the same company, so teams do not need to create and maintain their own classification logic.
One company identity becomes the link for the company knowledge graph.
Every classification is tied to that same company, keeping data consistent across the CRM, risk platform, and market intelligence system.
This makes everyday work more reliable.
Supplier searches find the same company across different classification systems, risk reports count each company once, and market-sizing results are more accurate.
New systems are easier to add to. Map the new system to the master taxonomy, match its records to known companies, and the new data fits with what you already have.
Consistency also needs to be maintained as companies change.
Firms merge, change their names, and open new locations. Keeping company identities up to date helps make sure the classifications stay correct.
A documented data methodology also makes the process easier to review.
Each mapped code includes its source and the reason behind the mapping, so anyone can check how it was decided. This keeps the mapping reliable over time.
Conclusion
The work is slow at the start and cheap afterwards. A documented taxonomy, a validated crosswalk, and one confirmed identity per company do not need rebuilding each quarter.
The bigger benefit comes later. New data plugs into one structure, which makes each acquisition, vendor feed, and new tool easier to absorb.
That makes every new system, acquisition, and data source easier to bring into the business.
The goal is not to make every system identical. It is to make sure they all speak the same language when it matters.
Articles
Discuss how these trends affect your organization.
Our analysts are available for a short call. Bring a specific question and we will ground it in the data.
Insights
Keep reading
More analysis, research, and outcomes grounded in live company intelligence.
Unlocking the Invisible 80%: How to Assess ESG Risks in Private Company Portfolios
In this article, you will learn how to assess ESG risks in private company portfolios and uncover risks that traditional data sources may overlook.
Why Legacy SIC and NACE Rev. 2 Codes Miss Modern Niche B2B Companies
Struggling with niche industrial product sourcing? Legacy industry codes fail modern B2B companies. Find out why and how to adapt.
How Is AI Revolutionizing Market Intelligence?
Explore the key ways AI is transforming market intelligence workflows and helping businesses stay ahead of the competition.