Insights / Articles
Physical Asset Management: Modeling Climate Risks at the Facility Level
Looking into facility-level climate risk modeling? This guide will explain how organizations can evaluate climate exposure across physical assets.

- 84% of FEMA flood map zones are over five years old.
- Less than 1% account for future climate conditions.
- Facility-level attributes reveal risks that flood zones alone overlook.
- Dynamic location intelligence strengthens underwriting and climate risk decisions.
Flooding has caused more than $1 trillion in damage (inflation-adjusted) across the U.S. since 1980, accounting for over 63% of all billion-dollar weather and climate disasters.
Yet many of the hardest-hit properties were never identified as high-risk by flood maps.
Heavy rainfall, blocked drainage systems, and changing weather patterns can put commercial and industrial properties at risk almost anywhere.
If your flood risk strategy still relies on decades-old flood zone maps, you could be overlooking significant exposures across your portfolio.
Why a Flood Zone Map Isn't Enough
Traditional flood zone maps may show you where the rivers were back in the 80s and 90s.
But it won't show you the changed climatic and weather patterns, or how the building next door handles heavy rainfall.
For commercial asset managers, underwriters, and risk professionals, this creates massive operational vulnerabilities.
Why?
Read further.
Official Flood Maps Are Often Outdated
According to Neptune Flood Research Group, 84% of FEMA FIRM mapped zones are outdated, meaning they are over five years old.
Quick note: The National Flood Insurance Program (NFIP), created in 1968, expanded flood insurance access and introduced FEMA's Flood Insurance Rate Maps (FIRMs).
And per the same research, about 6% still date to the 1970s and 1980s, long before today's rainfall patterns or urban sprawl existed.
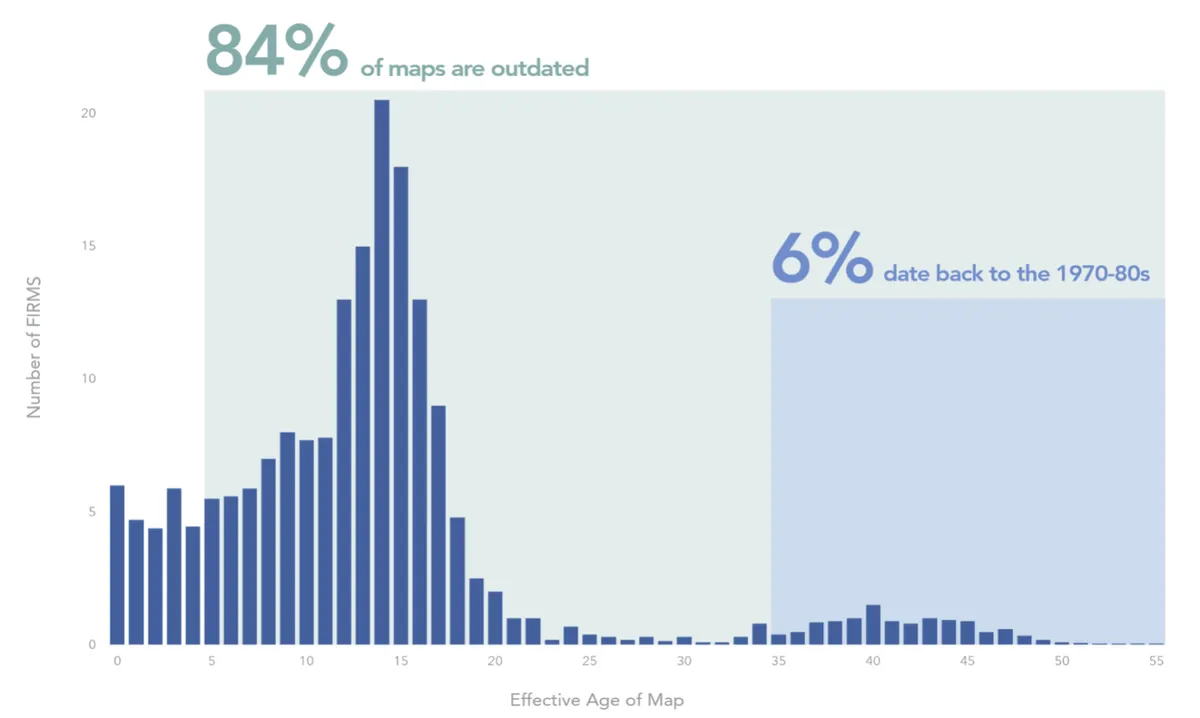
Source: Neptune
Think about how much a city changes over forty years.
When a facility relies on a map last updated in 1983, it evaluates modern climate risk using historic assumptions that no longer apply.
One coastal map used for Galveston, Texas, was last updated back in 2002.
When major weather events hit, the reality of this outdated data hits hard, and the financial impact is huge.
During Hurricane Debby, 78% of the flooded properties, representing ~$10 billion in damage, were located entirely outside designated high-risk flood zones.
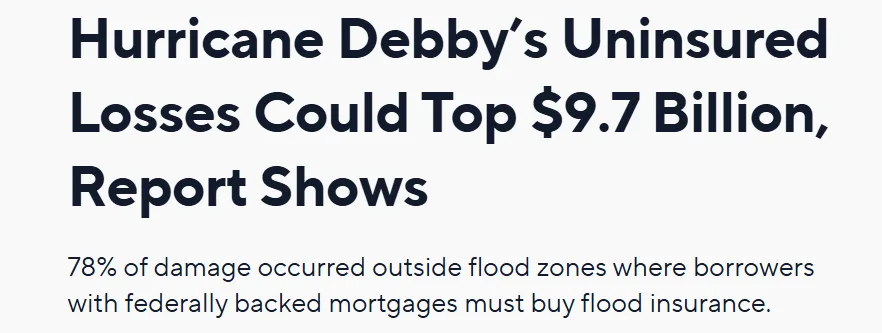
Source: Insurify
Similarly, before Hurricane Harvey hit Texas, 47% of all flood claims in Greater Houston over the previous three decades came from outside the official 100-year flood zones.
Quick note: A 100-year flood zone describes an area with a 1% chance of flooding in any given year, equal to roughly a 26% risk over 30 years.
A Reddit user’s observation sums up the situation perfectly.
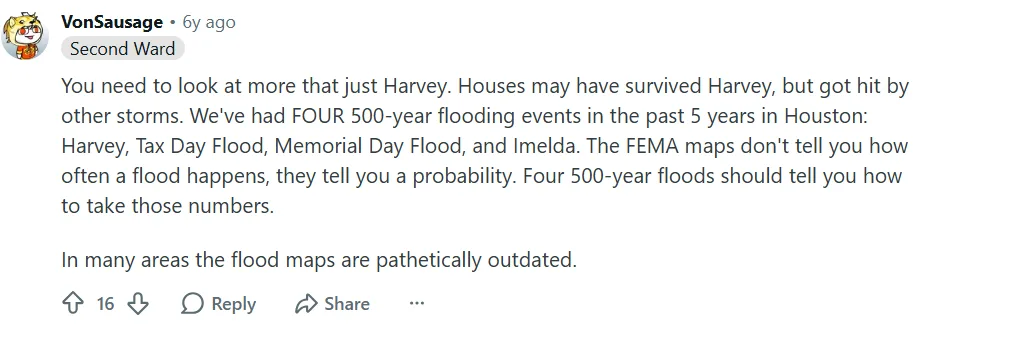
Source: Reddit
These properties were treated as 'safe' and exempt from stricter building standards simply because an outdated map said so.
And the part that should worry any asset manager is that a FEMA map still takes years to finalize, once you count public review and appeals.
By the time it's published, the world has already moved on.
So, if your facility-level risk management strategy relies solely on whether an asset sits inside or outside a government hazard line, you are exposing your balance sheet to massive unmapped liabilities.
Building Attributes Change Real Exposure
Two identical manufacturing plants sitting right next to each other on the exact same plot of land do not share the exact same risk.
Why?
Because macro-level hazard maps measure local geography, not the physical structural profile of the asset itself.
In a Norwegian water damage study covering over 729,000 unique property locations, researchers found that structural attributes like basement design, roof style, and building age directly altered expected annual claim frequency
Rather than depending only on past flood records or regional averages, they developed a building-level risk score to estimate the likelihood of water damage for individual properties.
The risk assessment was based on several factors, including:
- Building details, such as age, size, roof type, basement, property value, and whether it was rented.
- Weather conditions, including average rainfall and temperature.
- Topography, such as how easily water can collect or drain around the property.
None of these micro-level realities appear on a regional flood map.
The researchers also used future climate projections to understand how these risks could change over time.
Their analysis suggests that rainfall-related water damage is expected to rise across most parts of Norway.
Further, flood risk is projected to increase significantly along Norway's west coast, the Lofoten archipelago, and the Oslo region, with some areas expected to see increases exceeding 35% by the end of the century under a high-emissions scenario.
So, if your risk model treats every facility on the block as a generic, you are ignoring the precise physical features that determine whether an extreme weather event becomes a minor inconvenience or an operational disaster.
Proximity to Hazards Isn't a Yes-or-No Line
The traditional Special Flood Hazard Area framework forces a simple binary choice: a property is either 'in' the high-risk zone or 'out'.
This creates a dangerous false sense of security for facilities located just a few feet outside an official boundary line.
Nature does not stop flowing at an arbitrary line drawn on a government map.
Consider the flash flooding that struck Kerr County, Texas: devastating floodwaters destroyed assets located far outside mapped zones, where a mere 2.5% of property owners carried flood insurance.
And when Hurricane Helene struck, rural North Carolina suffered catastrophic damage miles away from traditional high-risk coastal zones.

Source: Courthouse News Service
In the same context, Susan Crawford, who now teaches at Harvard Law School after serving as senior fellow for sustainability and climate at the Carnegie Endowment for International Peace, is unequivocal in her assessment:
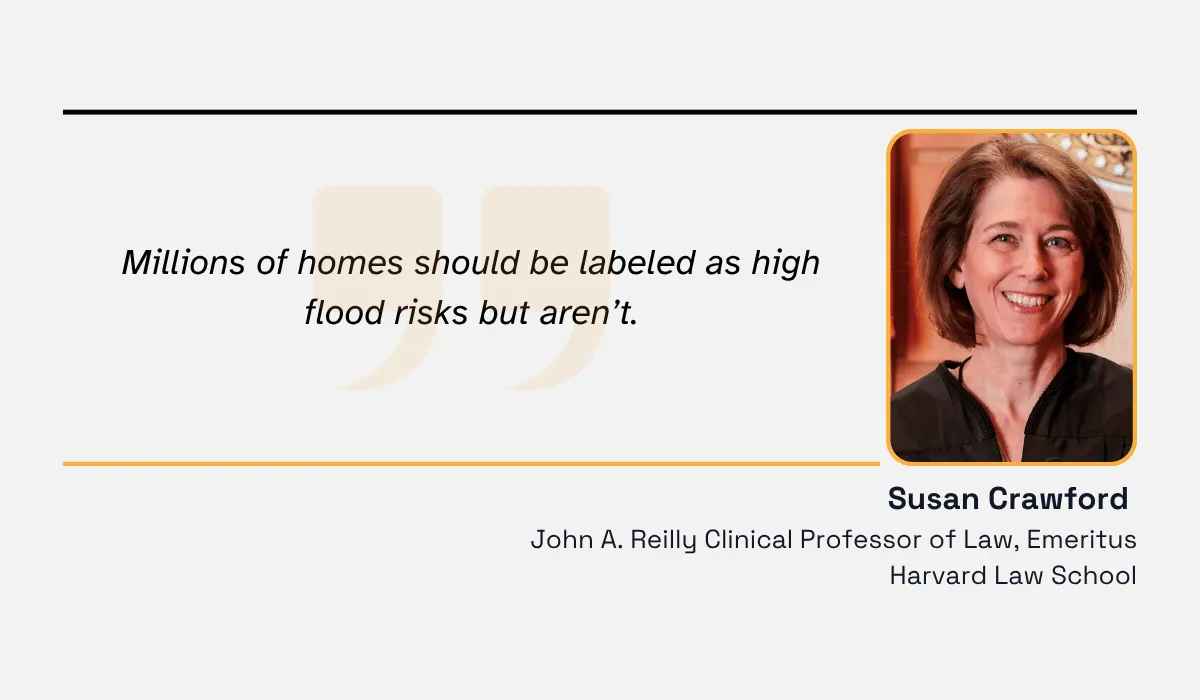
Illustration: Veridion / Quote: National Geographic
The problem is even bigger than it appears.
Roughly 40% of the continental U.S. remains completely unmapped!
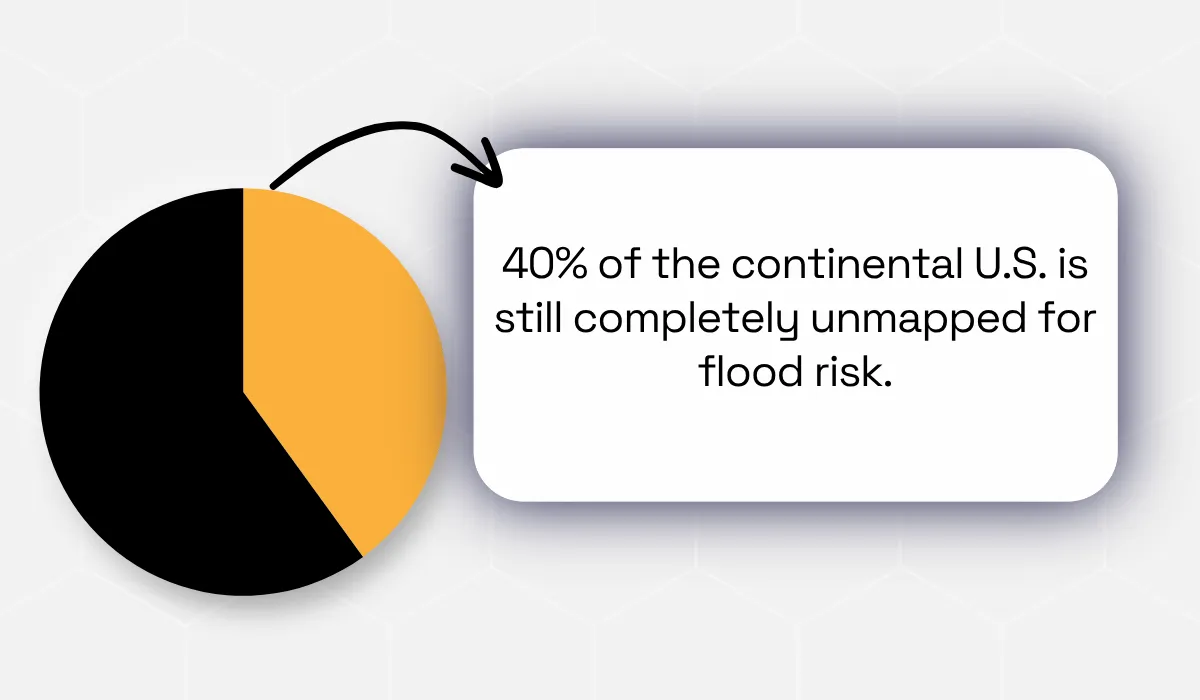
At the same time, most flood maps and risk models still rely on historical conditions instead of accounting for changing rainfall patterns, rapid urban development, and compounding storm events.
As a result, they miss millions of exposed sites.
In fact, modern commercial flood models show that nearly twice as many properties face severe 100-year flood events as government flood designations recognize.
Between 2019 and 2023 alone, more than 211,000 new structures were built in high-risk areas that were not identified on official maps and were treated as 'safe' simply because they fell on the wrong side of an arbitrary line.
So, when risk models reduce real-world exposure to a simple yes-or-no question, they fail to catch the complex spatial and meteorological dynamics that drive actual loss events.
How to Build a Facility-Level Risk Model
Less than 1% of mapped miles account for future conditions such as heavier rainfall and rising sea levels.
As weather patterns shift and extreme events become more frequent, historical flood maps alone can no longer provide a complete picture of physical risk.
That's why insurers and risk teams are increasingly building facility-level risk models that combine location, building, and hazard data.
Layer Structural and Attribute Data
A facility-level flood risk model is only as reliable as the data behind it.
Instead of depending on a single flood map or one environmental factor, modern models combine multiple structural and location-specific attributes to build a more complete picture of flood exposure.
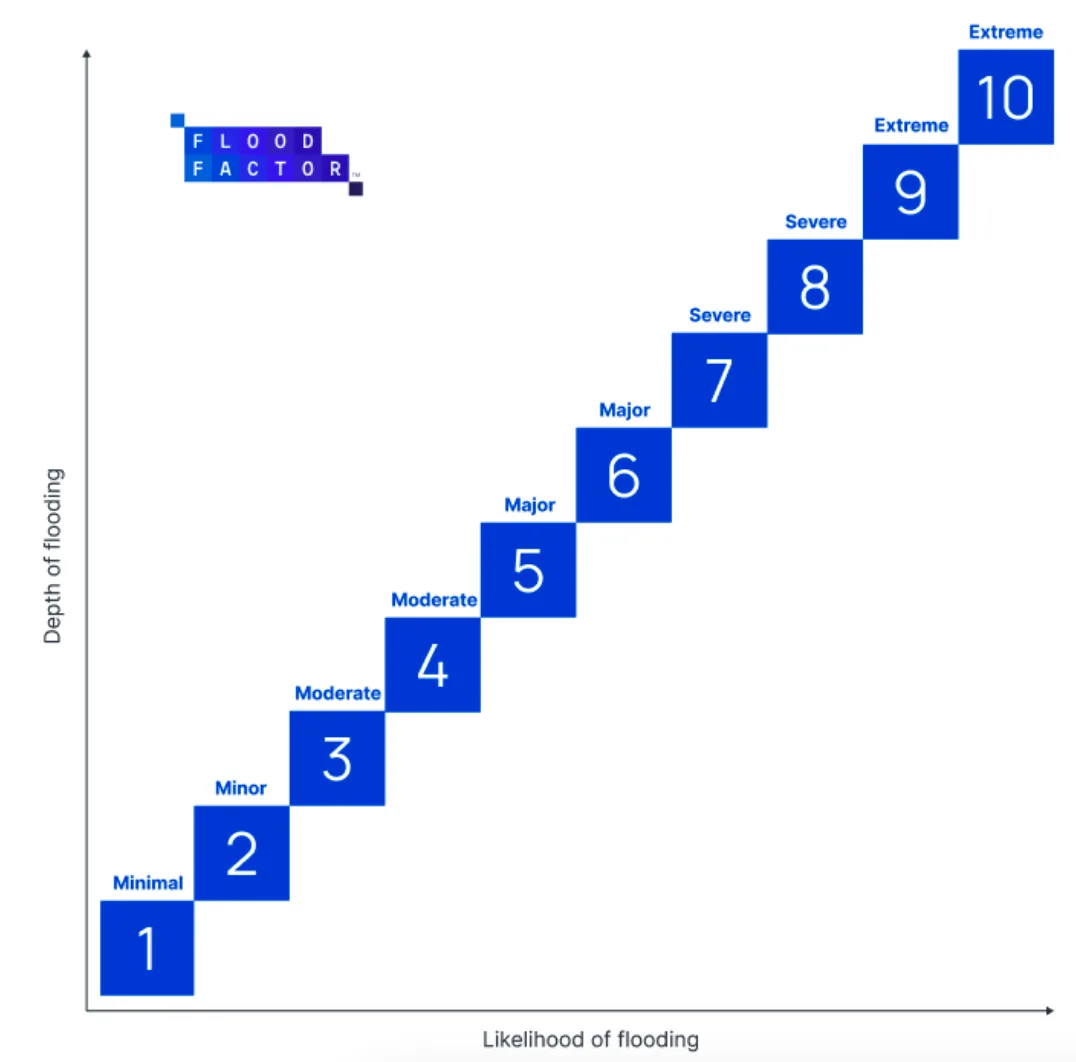
A good example is First Street's Flood Factor model, which generates a property-level flood score by combining multiple geospatial and environmental datasets.
Rather than assigning a simple flood zone label, the model estimates both how likely floodwater is to reach a building and how deep that flooding could be over 30 years.
To do this, it brings together other attributes such as historical flood records, elevation, rainfall patterns, proximity to rivers and coastlines, terrain characteristics, climate projections, and existing flood protection infrastructure like levees and flood walls.
These inputs are analyzed together to calculate a Flood Factor score from 1 to 10, giving insurers, lenders, and property owners a more detailed and statistical view of long-term flood exposure.
Source: First Street
Research has also shown that machine learning models become significantly more accurate when they analyze many flood-driving variables simultaneously instead of evaluating them individually.
Modern flood susceptibility models typically combine topographic, hydrological, climatic, and land-use data into a single predictive framework.
Common variables include:
- Elevation
- Slope
- Topographic wetness
- Rainfall intensity
- Soil type
- Drainage density
- Land cover
- Distance from rivers
- Stream power
Ensemble algorithms such as Random Forest, Gradient Boosting, and XGBoost then learn how these variables interact using historical flood events.
However, location characteristics alone are not enough.
Another important layer is understanding how close a facility is to critical points that can amplify operational disruption during a flood, as explained below.
Score Proximity to Critical Points
Flood risk is not determined only by how close a facility is to a river or whether it falls inside a FEMA flood zone.
It actually depends on how close it is to locations where floodwater is most likely to collect, flow, or enter developed areas.
These locations, often called critical points, include low-lying areas, drainage channels, river crossings, culverts, steep upstream catchments, and other places where surface runoff converges before reaching buildings or infrastructure.
For instance, per an MDPI-published white paper, Mitigation of Flood Risks with the Aid of the Critical Points Method, critical points can be identified by:
- Analyzing terrain
- Land slope
- Land use
- Drainage patterns, and
- Catchment areas
The researchers identified 9,261 critical points across the Czech Republic using GIS data and catchment characteristics.
These locations are more likely to experience flash flooding and flood-related damage during intense rainfall.
They also found that these critical points were connected to more than 18,100 km² of catchment areas.
This shows that a relatively small number of high-risk locations can influence flooding across a much larger region.
Instead of treating every location the same, the study grouped areas based on their level of flood risk.
Further, it allows authorities to focus mitigation efforts on places where they will have the greatest impact.
This type of analysis is becoming increasingly important because traditional flood maps often underestimate actual exposure.
For context, FEMA identified about 8.7 million U.S. properties as being located in flood hazard areas in 2020.
By June 2023, the First Street Foundation’s updated precipitation model estimated that 17.7 million properties faced substantial flood risk or higher.
That puts the newer estimate at more than twice the 2020 figure, highlighting how flood exposure assessments have expanded as models incorporate updated climate and precipitation data.
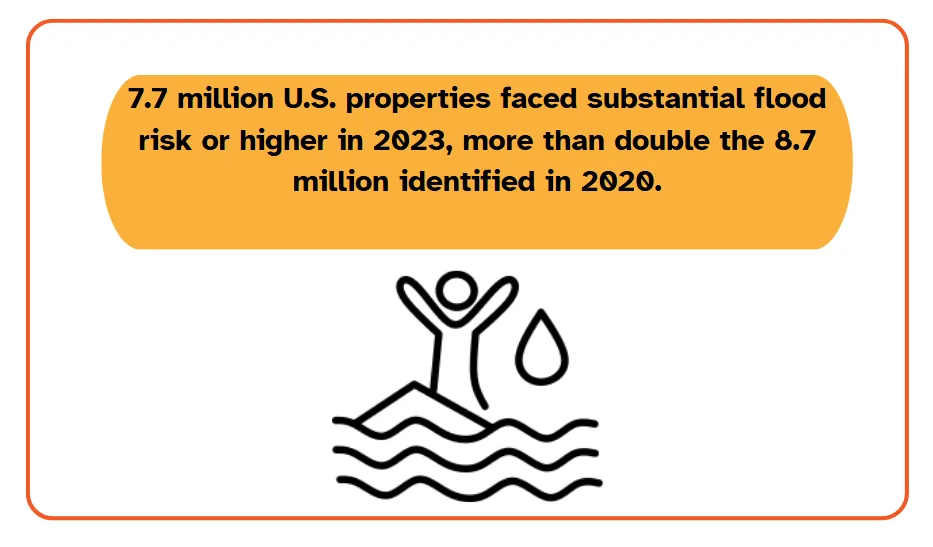
Illustration: Veridion / Data: FirstStreet
For facility-level risk models, scoring proximity to critical points provides a more complete picture of flood exposure than relying only on flood zone boundaries.
Facility-Level Data Behind Precise Risk Models
Risk models built on building and location attributes are a major step toward better underwriting.
However, relying just on zone-level flood maps still gives an incomplete view of climate hazards.
Source: Smithsonian Magazine
Natural disasters rarely cause a single type of damage.
During Hurricane Harvey in 2017, for example, flooding across the Texas Gulf Coast led to more than 200 contaminant releases.
This shows why understanding a facility's exact location, nearby infrastructure, and surrounding environment is just as important as knowing whether it falls inside a flood zone.
Veridion supports this process by combining underwriting data analytics with location intelligence.
The platform maps businesses to site-level locations and enriches them with structured company attributes, including industry classification, operational activity, and location market intelligence.
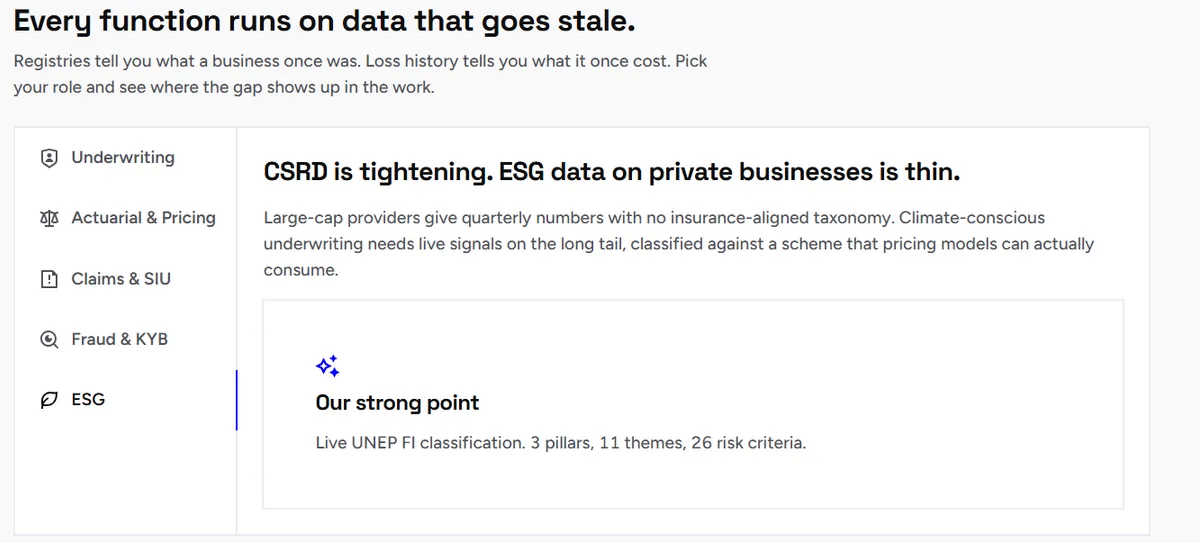
Source: Veridion
This allows organizations to combine Veridion's data with third-party climate and hazard models to assess the exposure of each facility individually rather than applying the same risk to an entire geographic zone.
Whether identifying secondary warehouse locations or evaluating climate-related exposure across large portfolios, Veridion provides current, auditable commercial underwriting data through APIs and batch delivery, enabling more accurate underwriting and enterprise risk management.
Conclusion
Flood maps still play an important role, but they should not be your only source of risk information.
Combining them with facility-level risk models, location intelligence, and regularly updated data provides a far more accurate picture of flood exposure.
This layered approach helps underwriters, risk managers, and businesses identify vulnerabilities earlier, prioritize mitigation efforts, and make more confident decisions before the next flood event.
Articles
Discuss how these trends affect your organization.
Our analysts are available for a short call. Bring a specific question and we will ground it in the data.
Insights
Keep reading
More analysis, research, and outcomes grounded in live company intelligence.
Underwriting Data Analytics: A Guide
Learn what underwriting data analytics is, how it’s being used, and the best practices to keep in mind when implementing it.
Climate Risk Modeling: What You Need to Know
Learn what climate risk modeling actually involves, how to put it into practice, and how it relates to real business use cases.
How Veridion’s Data Improves the Accuracy of Climate Risk Models
Find out in which ways Veridion's granular data can improve the accuracy of climate risk models and change the game for your organization.