Insights / Articles
What Counts as True Facility-Level Data?
What truly defines facility-level data? Uncover the critical internal variety switch and ensure your data accuracy for better decision-making.

- A single address can conceal multiple businesses, functions, or dependencies.
- A facility’s role can change dramatically without its address changing.
- Facility-level details can reveal supply chain risks that supplier-level data misses.
- What happens in a facility can influence underwriting, market sizing, and risk analysis.
Your data says a supplier has one manufacturing plant. In reality, three tenants share the building.
It says a facility is active, but it actually closed eight months ago.
A location labeled as a regional office turns out to be the company's primary distribution operation.
The problem isn't the address. It's everything the address fails to tell you.
This article explains what counts as true facility-level data and how those attributes improve underwriting, supply chain visibility, and market intelligence.
What Does a True Facility-Level Dataset Actually Contain?
A facility-level dataset captures what physically exists at a site, what the site is used for, and how it relates to the wider organization.
The key distinction is between data that merely labels a location and data that reflects its operational reality.
A true facility-level record keeps these attributes tied to the correct physical location and updated as the site changes.
Facility Type and Function
One of the most important fields in a facility-level dataset is its actual function.
A static classification might label an address as an office, commercial property, or another broad category.
That tells you how the location fits a predefined taxonomy.
Facility function tells you what the company actually uses the site for.
That could mean a headquarters, branch office, warehouse, manufacturing plant, distribution center, laboratory, research & development (R&D) site, data center, or another operational facility.
Two locations within the same company can have completely different operational significance, even if they share similar administrative classifications.
A facility can also perform multiple functions at once.
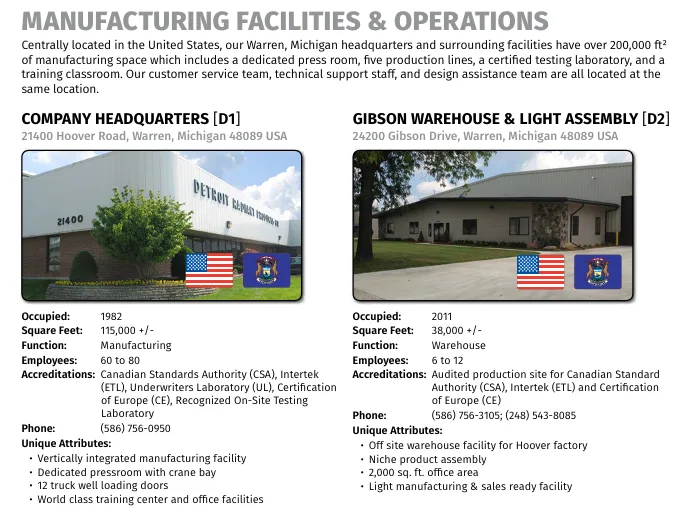
For example, heating and ventilation company Detroit Radiant Products lists its Warren, Michigan headquarters alongside more than 200,000 square feet of manufacturing space, with office and technical functions operating at the same location.
Source: Detroit Radiant Products
Its separate Gibson Drive facility combines warehouse operations, light assembly, and office space.
That means a robust facility dataset shouldn’t necessarily force every location into a single, mutually exclusive category.
When evidence supports multiple functions, the record should preserve them.
Otherwise, a classification such as "office" could obscure the manufacturing, warehousing, or distribution activity happening at the same site.
Treating these functions as interchangeable obscures the differences procurement teams need to manage risk effectively. Veridion's guide to classifying supplier facilities by operational function explores these distinctions in more detail.
Function should also be treated as a changeable attribute.
Companies move, consolidate, expand, repurpose, and close facilities, so a site's role today may differ from its original purpose.
Agricultural company CLAAS's Columbus, Indiana facility illustrates this clearly.
Source: Farm Equipment
The company originally built the site as its U.S. corporate headquarters; after the headquarters moved to Omaha, the same location became the CLAAS Parts Center and was expanded into a 175,000-square-foot parts distribution facility.
An address tells you where a company has a location, while its function tells you what that location means to the business.
A dataset that captures both and allows function to change over time gives you a much more accurate picture of the company's physical operations.
Size and Operational Capacity
Facility size provides a basic measure of a site's physical scale, but it doesn’t tell you how much activity that site actually handles.
A 10,000-square-foot office and a 500,000-square-foot distribution center may belong to the same company, yet they represent very different levels of physical footprint and operational exposure.
That's why facility-level data should capture size alongside other capacity signals.
Square footage indicates physical scale, while on-site headcount, utilization, inventory, and throughput provide additional context about activity.
Recent warehouse data illustrates how much scale can vary even among facilities performing the same function.
The 2024 Warehouse/DC Operations Survey found an average of 408,020 square feet across respondents' distribution center (DC) networks and an average of 146 employees at their main DC. Yet 25% of respondents reported fewer than 10 employees at their main DC, while 15% reported 200 or more.
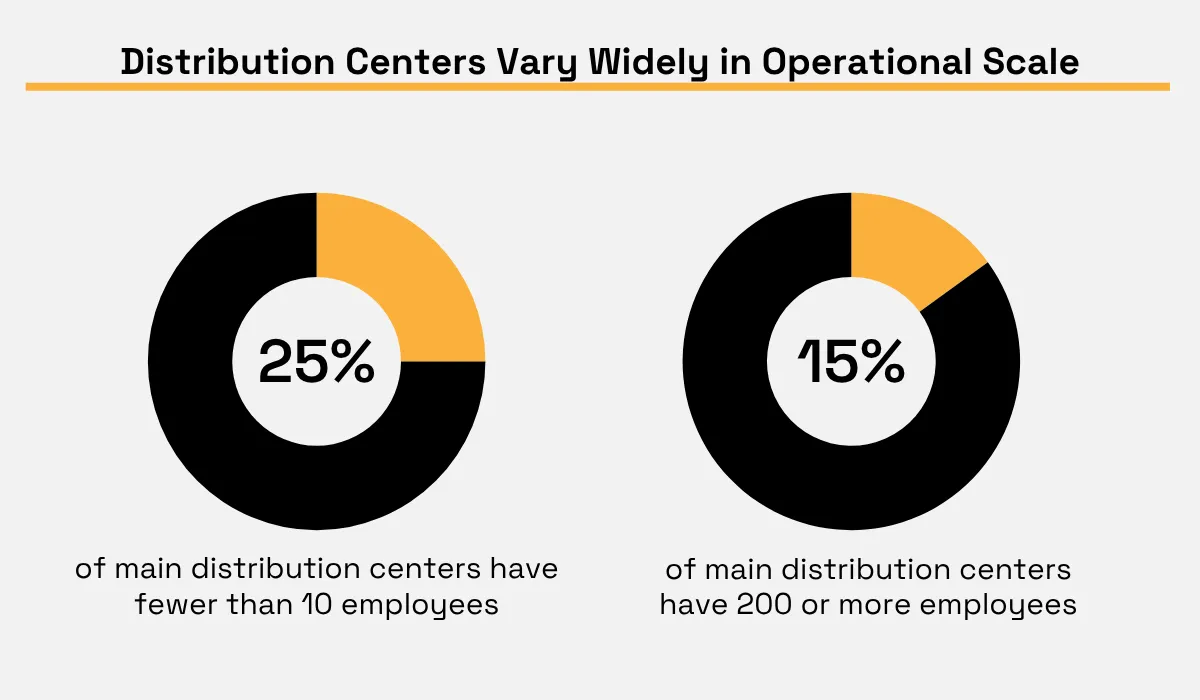
Illustration: Veridion / Supply Chain Management Review
A "distribution center" label alone therefore hides considerable variation.
And physical size shouldn't be confused with operational criticality.
A large facility may have readily available substitutes, while a smaller site may perform a specialized function with little redundancy.
Direct throughput data is rarely available in public company records, so data teams often need to use proxies.
These can help estimate operational scale, provided you keep the underlying measurement separate from the estimate:
Signal | What it indicates |
|---|---|
Physical footprint | Available space and potential storage or operating capacity |
On-site workforce | Workforce intensity and operational scale |
Utilization | How much of the available capacity is being used |
Throughput | Volume of goods, orders, shipments, or production moving through the site |
The key isn’t to collapse these signals into a single measure of "facility capacity."
Square footage isn't throughput, headcount isn't capacity, and a large footprint doesn't automatically make a site business-critical.
A well-designed facility-level dataset preserves these measurements separately so downstream teams can combine them according to their specific use case.
Operational Status
A facility appearing in a dataset doesn’t mean it’s still operating.
Companies close sites, relocate operations, consolidate facilities, and leave legal registrations active after operations stop.
Without a “current operational status” field, a closed or dormant address can be mistaken for an active facility.
A 2025 study of machine-generated business-location data found that 16.7% of establishments in its sample were closed.
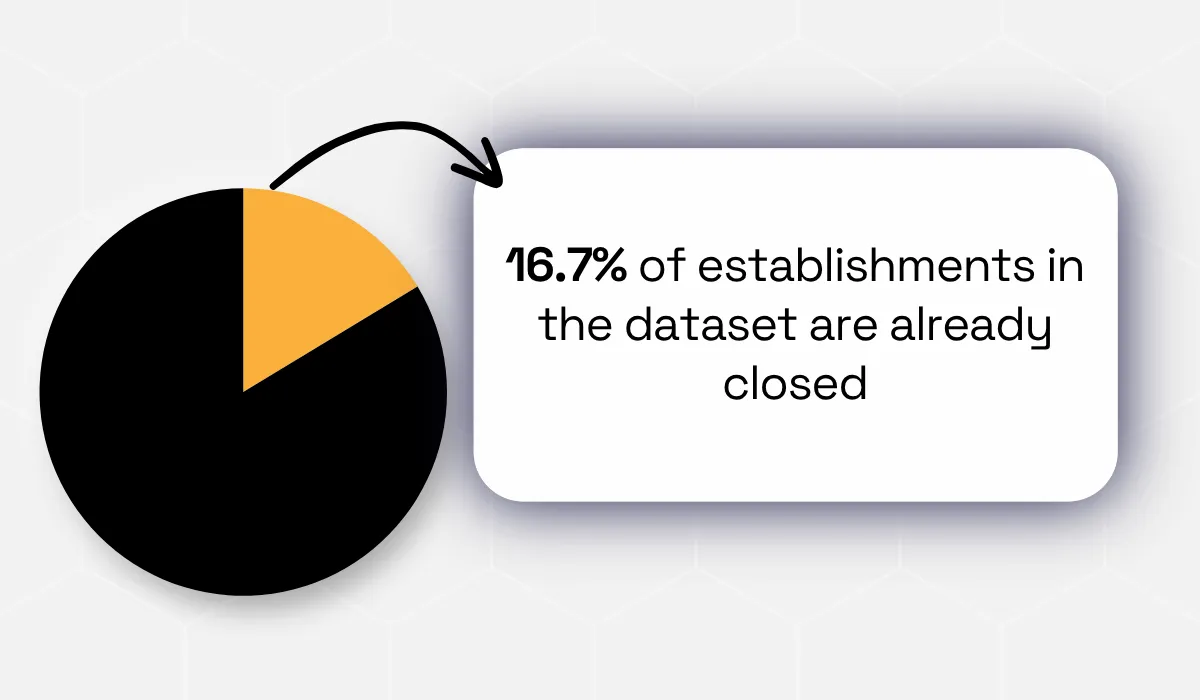
Illustration: Veridion / Source: Social Science Computer Review
Some records remained in the dataset for businesses closed for up to seven years, showing how long outdated locations can persist.
Registration status provides another example of why these concepts should remain separate.
San Francisco’s business registry includes an “Administratively Closed” status for locations that haven’t filed or communicated with the city’s Treasurer & Tax Collector for three years.
The registry also records location start and end dates, allowing users to distinguish a current location from one that is no longer active.
For facility-level datasets, a listing does not prove current operations.
A useful record should indicate whether a facility is currently active and, where possible, when its status changed.
Closure dates, relocation signals, recent business activity, property occupancy, and other current evidence can help validate whether a site still represents a functioning operation.
This distinction becomes important when you use facility data for market sizing, risk analysis, or account selection.
A closed warehouse can inflate a company's apparent logistics footprint, and an abandoned headquarters can make a company appear to maintain a presence in a market where it no longer operates.
The more decisions you make at the site level, the more important it becomes to know whether the facility is actually active today.
Co-Tenancy and Shared-Site Relationships
A physical site may host multiple businesses rather than belonging exclusively to one company.
Industrial parks, warehouse complexes, business centers, and multi-tenant commercial properties can contain several independent occupants under the same street address.
This makes co-tenancy an important facility-level attribute.
In a 2022 U.S. Securities and Exchange Commission (SEC) filing from an industrial property portfolio, 52.8% of leased space was in multi-tenant properties, compared with 47.2% in single-tenant properties.
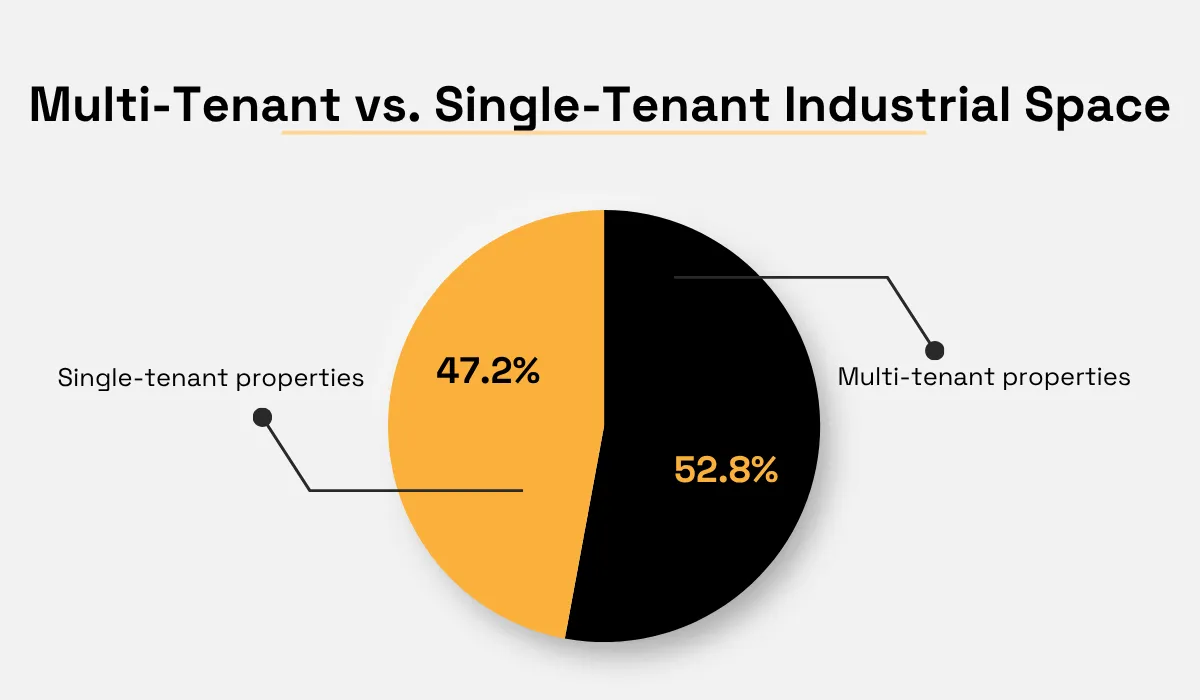
While this represents one property portfolio rather than the entire industrial market, it illustrates why an address shouldn’t automatically be treated as a single-company facility.
A complete facility profile should therefore capture whether a site is single-tenant or shared and, where possible, which companies operate there.
That information can reveal physical exposure and operational dependencies that company-level records miss.
In a 2024 analysis of multi-tenant commercial properties, Lockton, a global independent insurance broker and risk management firm, cited a fire in the Netherlands that destroyed ten connected warehouse units after starting in a paper-recycling facility.

Source: Lockton
Although the recycling unit survived, insurers treated the connected property as a total loss and required a full rebuild.
The incident shows how a single tenant can create physical exposure across a shared site.
Co-tenancy also affects how you interpret a facility's footprint.
A company occupying one unit in a 500,000-square-foot complex shouldn’t automatically be assigned the entire 500,000-square-foot footprint.
Shared loading areas, utilities, security, fire protection, and access infrastructure can also create dependencies between occupants.
For data teams, the distinction is therefore between the physical site and a company's presence within that site.
Instead of recording only:
Company A → 123 Industrial Road
a richer dataset can represent:
Company A → Unit 4 → 123 Industrial Road
It can then associate other occupants and site-level attributes with the same physical location.
This preserves relationships that can materially affect risk, capacity, and operational analysis.
How Does Facility-Level Data Change Underwriting, Supply Chain, and Market Research Outcomes?
Facility-level data changes more than how you map a supply chain. It can change how you assess risk, estimate operational exposure, price insurance, and size a market.
An address tells you where a business is. Facility-level data tells you what is happening there and how that site functions within the wider business network.
That context can materially change the conclusions you draw in commercial underwriting, supply chain risk, and market intelligence.
Occupancy and Construction Context for COPE-Based Underwriting
Commercial property underwriters commonly use the COPE framework (Construction, Occupancy, Protection, and Exposure) to evaluate property risk:
COPE factor | What it captures |
|---|---|
Construction | Building materials, roof, age, size, and structural characteristics |
Occupancy | Activities performed, materials stored, equipment used, and associated hazards |
Protection | Sprinklers, alarms, fire protection systems, and other safeguards |
Exposure | Surrounding hazards, neighboring properties, and external risks |
For facility-level data, occupancy matters because the company’s industrial classification may not reflect what actually happens at a specific site.
A company classified as a manufacturer may operate an office at one address, a storage facility at another, and a plant using heavy machinery or combustible materials at a third.
Treating all three locations as generic company locations gives an underwriter an incomplete picture of the risk at each property.
The construction data can be just as important.
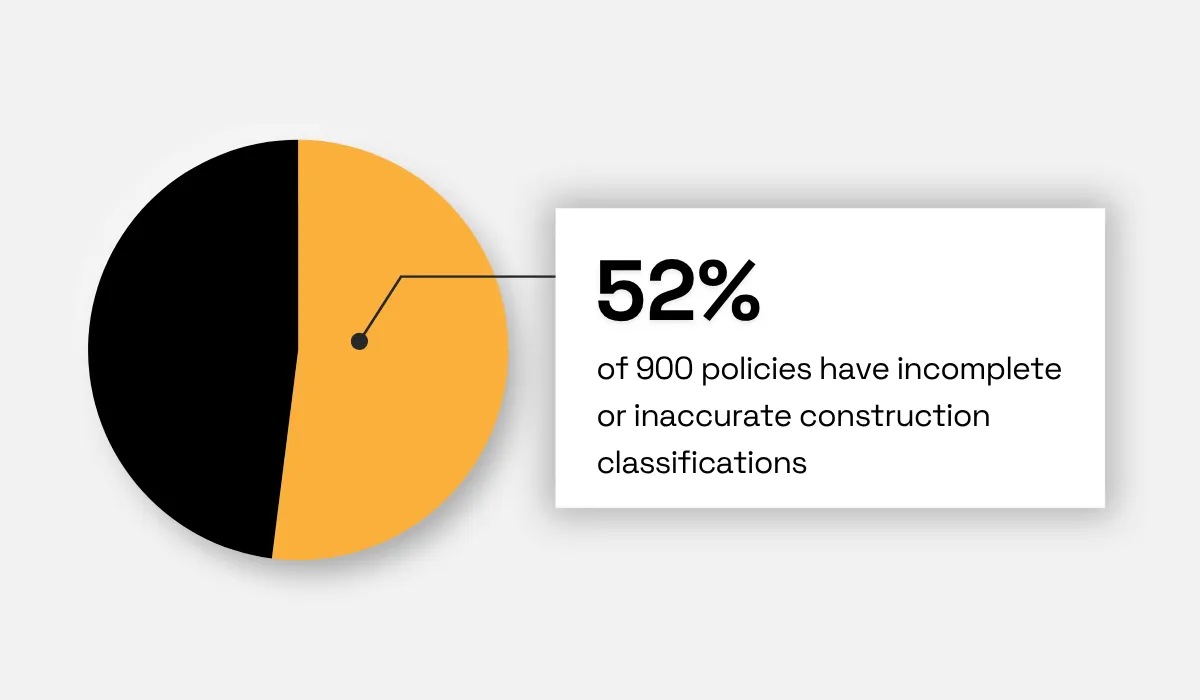
In a Verisk assessment of 900 policies, 52% had incomplete or inaccurate construction classifications. Of those, 19% were classified in a lower-risk construction class than Verisk verified through site visits, creating potential premium leakage for the insurer.
Knowing which company occupies an address isn't enough to assess the property's risk.
You also need to know what the facility is used for, how it is constructed, what protections it has, and what exposures surround it.
Accurate facility-level data gives underwriters a more precise view of the individual property.
Instead of applying broad assumptions based on a company's industry or a property's address, they can evaluate the specific physical and operational characteristics that drive risk at that site.
Visibility into Hidden Supply Chain Risks
Address-only supplier maps can make a supply chain appear more diversified than it really is.
Two suppliers may have different company names but depend on the same manufacturing plant, warehouse, contract manufacturer, or logistics hub.
Conversely, one supplier may operate several sites while one facility handles a disproportionate share of its production or distribution.
The facility can therefore be a more useful unit for understanding concentration risk than the supplier record alone.
Mapping dependencies beyond direct suppliers can reveal physical sites that appear repeatedly across otherwise separate supply paths.
A single component manufacturer or logistics hub, for example, may support several suppliers and create a shared dependency that is invisible when you assess each supplier independently.
Facility function adds another layer of context.
A supplier’s three warehouses aren’t necessarily equivalent.
One might be a small regional storage site, while another serves as a central distribution hub for several markets.
The 2018 KFC UK chicken shortage illustrates how this can create vulnerability.

Source: Wired
KFC had previously relied on Bidvest’s distributed networks of six regional warehouses before switching to DHL, which consolidated much of the distribution operation into a single depot in Rugby.
When problems emerged in the new distribution model, the network lacked sufficient alternative nodes to absorb the disruption, and more than two-thirds of KFC's UK restaurants were forced to close within three days.
The case shows why knowing which supplier you depend on isn’t always enough.
You also need to know which facilities perform critical functions and how much of the network depends on them.
You can assess facility criticality using three practical questions:
- How much of the operation depends on the site?
- How difficult would it be to substitute?
- How many apparently independent supply paths converge there?
A site that supports a large share of production, has few viable alternatives, or serves multiple suppliers or business units deserves more attention than a peripheral facility with readily available substitutes.
For data teams, this means supplier mapping should preserve relationships among company, facility, function, and dependency.
That lets you move beyond a list of supplier addresses and identify the physical nodes where a disruption could have the greatest downstream impact.
Facility Type and Size as Market-Sizing Inputs
The unit you count directly affects the accuracy of your market estimate.
If you're estimating manufacturing footprint, warehouse capacity, or the number of operational sites in a market, counting every address equally can distort the result.
The relevant question isn’t how many addresses exist, but how many relevant facilities exist, what they do, and what scale they represent.
If you're estimating manufacturing capacity, you can focus on production sites rather than administrative offices. For logistics analysis, you can isolate warehouses and distribution centers and use size or other capacity signals to distinguish major facilities from smaller sites.
This is the operational layer that facility-level data adds beyond address geocoding.
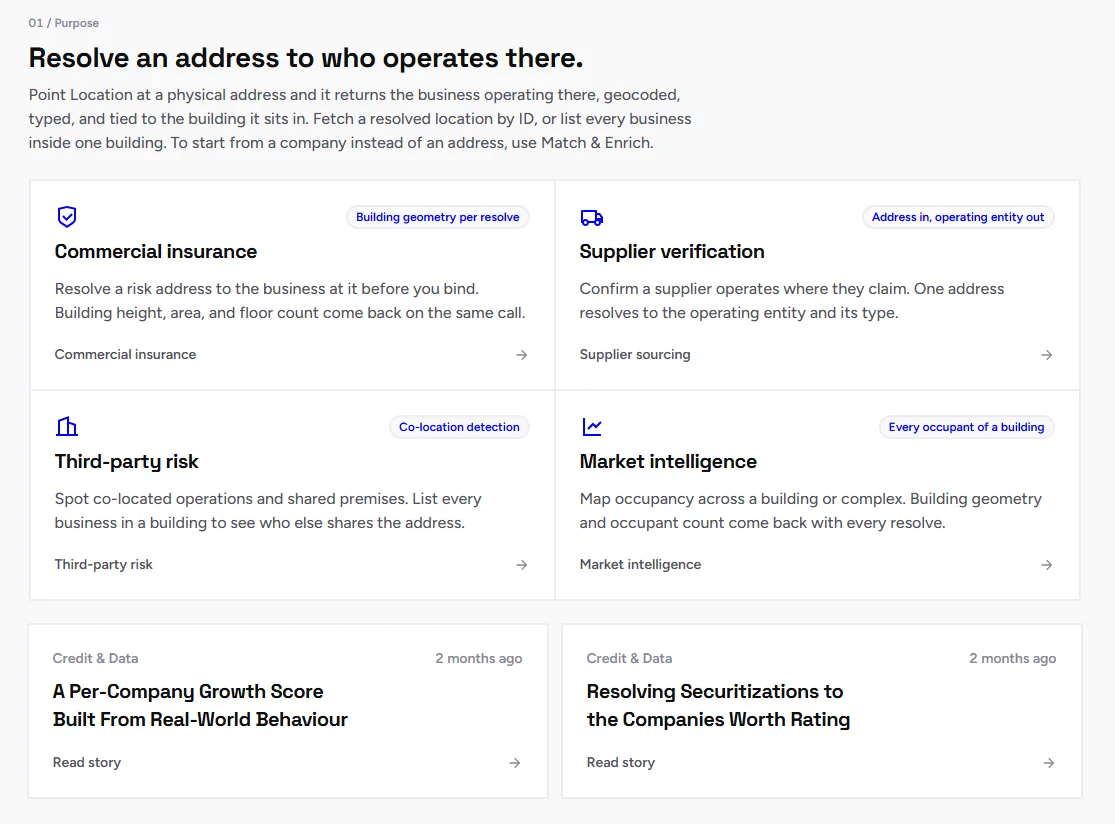
Veridion's data includes company, location, business activity, industry, and other attributes, allowing data teams to connect physical locations with the companies and activities operating there.
Source: Veridion
This gives data teams the operational context to build more accurate market estimates and supports vendor management teams that need to understand where suppliers actually operate.
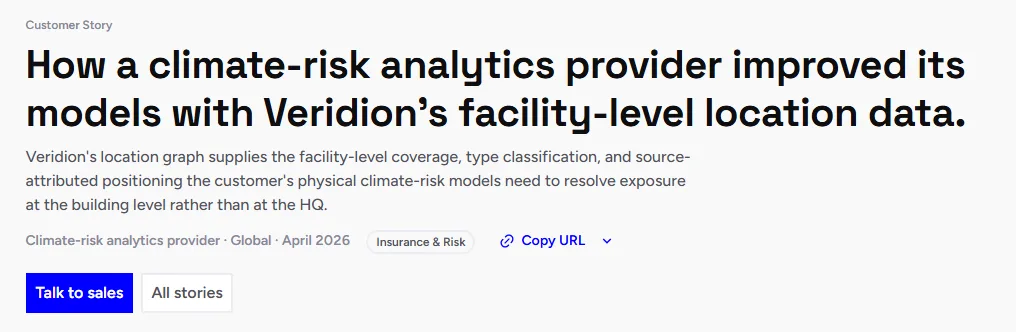
A Veridion customer illustrates the value of this approach.
A climate-risk analytics provider needed to model exposure at the asset level rather than using companies’ registered headquarters as proxies.
Source: Veridion
Veridion’s location graph provided operating sites with building-level positioning and facility-type classifications, distinguishing manufacturing, distribution, office, retail, R&D, and warehouse locations.
The provider could therefore attribute exposure according to what each physical site actually represented, rather than treating every company address as an equivalent asset.
For market intelligence teams, the same principle applies: the unit you count should match the market you're trying to measure.
Facility type and size help turn an address inventory into a more meaningful estimate of the physical market.
Conclusion
The cost of skipping the facility-level data layer isn’t abstract.
It shows up when underwriters price risk without accurate occupancy details, supply teams discover that multiple suppliers depend on the same site, and market analysis overcounts capacity because an address list can’t distinguish a headquarters from a warehouse.
In each case, the failure comes from treating location as a static fact rather than an operational reality that needs to be verified, enriched, and kept current.
The good news is that this is solvable.
Data teams and technical professionals can build a facility layer that answers four essential questions: what happens there, how large is it, is it active, and who else is there?
When your data can answer those questions, an address stops being just a point on a map and becomes a meaningful view of the physical business world.
Articles
Discuss how these trends affect your organization.
Our analysts are available for a short call. Bring a specific question and we will ground it in the data.
Insights
Keep reading
More analysis, research, and outcomes grounded in live company intelligence.
Beyond the Address: How to Classify HQ vs. Manufacturing Facilities Globally
Confused by commercial location classification? Understand the difference between HQ and manufacturing facilities globally.
Classifying Supplier Facilities by Operational Function
Learn how to classify supplier facilities based on their operational functions to improve visibility and supply chain efficiency.
Why Supply Chain Mapping is Important
This article shows why visibility into your supply chain is no longer optional and how mapping helps you stay ahead.