Insights / Articles
Our Guide on Turning Raw Market Signals into Confident Planning Decisions
Struggling to translate raw market signals into confident planning decisions? This guide transforms complex data into actionable strategies.

- 89% of B2B marketers say evolving buyer preferences are now a top challenge.
- Search trends, purchasing patterns, and customer feedback each reveal a different stage of market demand.
- Watching a competitor's hiring and pricing timing reveals their next move before it becomes public.
Planning is only as good as the raw market signal behind it.
However, strategy teams have to work out which signals aid their planning and which are simply noise.
This matters because acting too early, too late, or on the wrong signal can shape everything from product strategy to market expansion.
So, in this guide, you'll learn how to target meaningful market signals from noise and use them to make more confident planning decisions.
What Counts as a Market Signal?
A market signal is any observable data point that hints at where your market is heading before the change becomes obvious to everyone else.
It could be a customer asking for something your product doesn't offer yet, or a competitor changing how it prices a service.
You've probably been flooded with information that could be thought of as market signals.
The challenging part with these data points is determining which ones matter for the goal of your business.
Researchers have been wrestling with this for decades.
Back in the 1970s, Igor Ansoff, often called the father of strategic management, described early indicators of market change as inherently vague and easy to dismiss, arriving well before anyone had enough information to act with confidence.
This shows that raw signals happen enough because they don't tell you much about where things are headed; you still need structure and context before using them for planning.
That's why strategy teams watch a small, consistent set of categories instead, which is where we're headed next.
Four Signal Categories Strategy Teams Should Track
Trying to monitor every data point that touches your market is unrealistic because there are too many of them, and most of them won't matter six months from now.
Instead, you want to watch out for these four smaller, consistent categories because they're the most reliable.
And each one surfaces a different kind of early indicator, which, taken together, will give you a far more complete picture than any single source could on its own.
Shifting Customer Demand
What your customers are buying, asking for, or complaining about is constantly changing.
This change is being felt by the marketers firsthand; 89% of them rank evolving buyer preferences as a top challenge that's pushing them away from the one-size-fits-all campaigns they used to rely on.
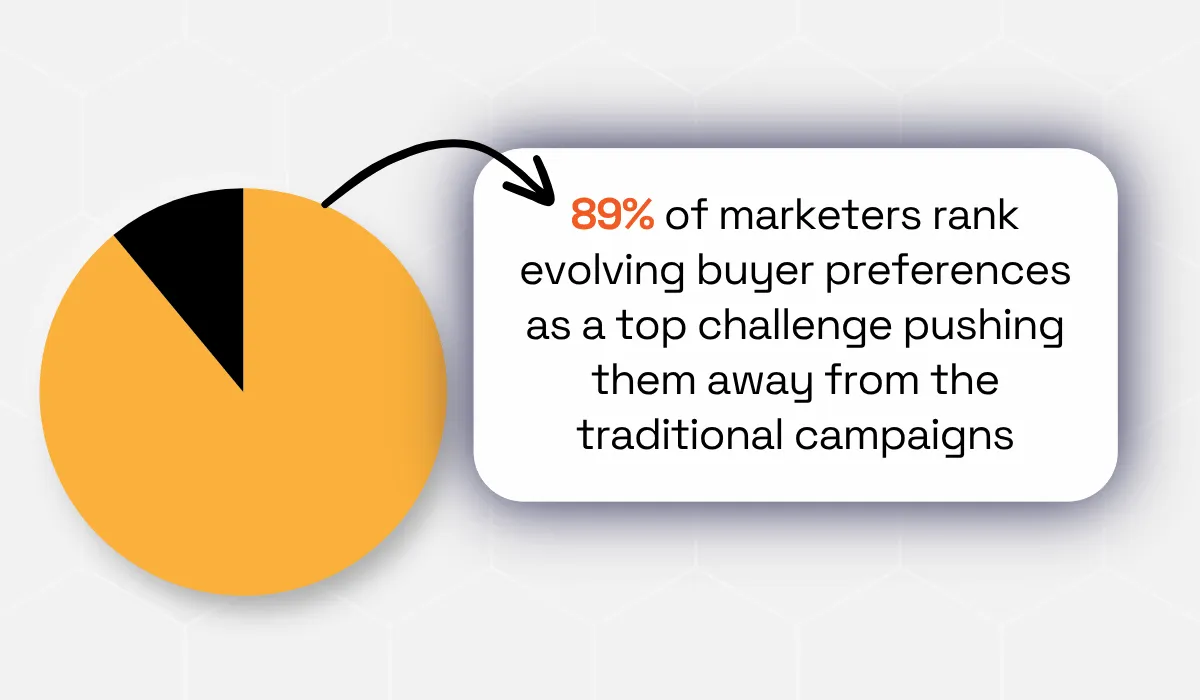
Illustration: Veridion / Data: Demand Gen
Those campaigns only ever gave you a handful of broad, generic signals, and broad signals aren't something you can afford to lean on right now.
This is why narrowing your focus on these three things works better than trying to track everything. They'll consistently point you to where your customers are turning to:
- Search trends
- Purchasing patterns
- Customer feedback themes
Search trends
Search trends capture intent before a customer has spent anything or told anyone what they want, which is why they tend to surface earliest in the four signals.
A tool like Google Trends will show you search volume for terms tied to your category over time, and the useful read is in what's rising.
Watch for two kinds of search.
The problem-based searches,-these phrases like "how to reduce vendor onboarding time" or "alternative to manual KYB checks," tell you customers are recognizing a need before they've found a name for the solution and give you time to shape their conversation.
And, the comparison searches. These phrases pair your category with a competitor's name, telling you customers already know the solution exists and are choosing between vendors.
That's your cue to check where you show up in that comparison: is your site ranking against that competitor's name? Does your sales team have comparison material ready? Are your pricing and differentiators easy to find without a call?
Missing this cue alone can make a customer pick your competitor before you even knew you were being considered.
Purchasing patterns are where their intent turns into action and money.
It's a later-stage signal than search, and a more reliable one because with search, it costs nothing to abandon, so it only tells you interest exists.
A purchase is a bigger commitment because of switching costs: once a business has signed a contract, integrated a tool, or trained a team on it, reversing that decision means losing costs, time, and effort.
A downgrade or a lost renewal doesn't automatically mean a customer disliked your product. It could just as easily mean their champion left the company, budgets tightened company-wide, or your service got folded into a supplier-list consolidation that had nothing to do with you at all.
So, when a series of this happens, pull the cancellation notes for that specific cluster of accounts and let the account tell you what actually happened before you decide whose job it is to fix it.
Expansion works the same way. Adding seats, upgrading tiers, or finally adopting a feature is the clearest way an account can tell you exactly where they're seeing more value in what you sell.
If this is something done across a couple of accounts in the same or similar segments, you get a preview of what the rest of that segment is about to want in your product roadmap.
Ultimately, you treat their purchase pattern as a guide for your next line of action.
Customer feedback themes are where your customers are telling you what they:
- Liked
- Disliked
- Need improvement on
One key benefit is that it is direct and in the customer’s own words, instead of you having to infer it from behavior.
A complaint can point you to a common problem or an unmet need, especially when it's shared by more than one customer.
Olipop, a prebiotic soda brand, shows all three working together.
The brand tracked search interest and community conversation around gut-health soda for years before the category reached the mainstream.
That early demand translated directly into buying behavior.
As the company scaled its distribution, its founders reported sales growing nearly 900% in a single year, driven largely by repeat purchases, not just first-time trials.
Olipop also built customer feedback directly into its product pipeline.
As co-founder Ben Goodwin put it,
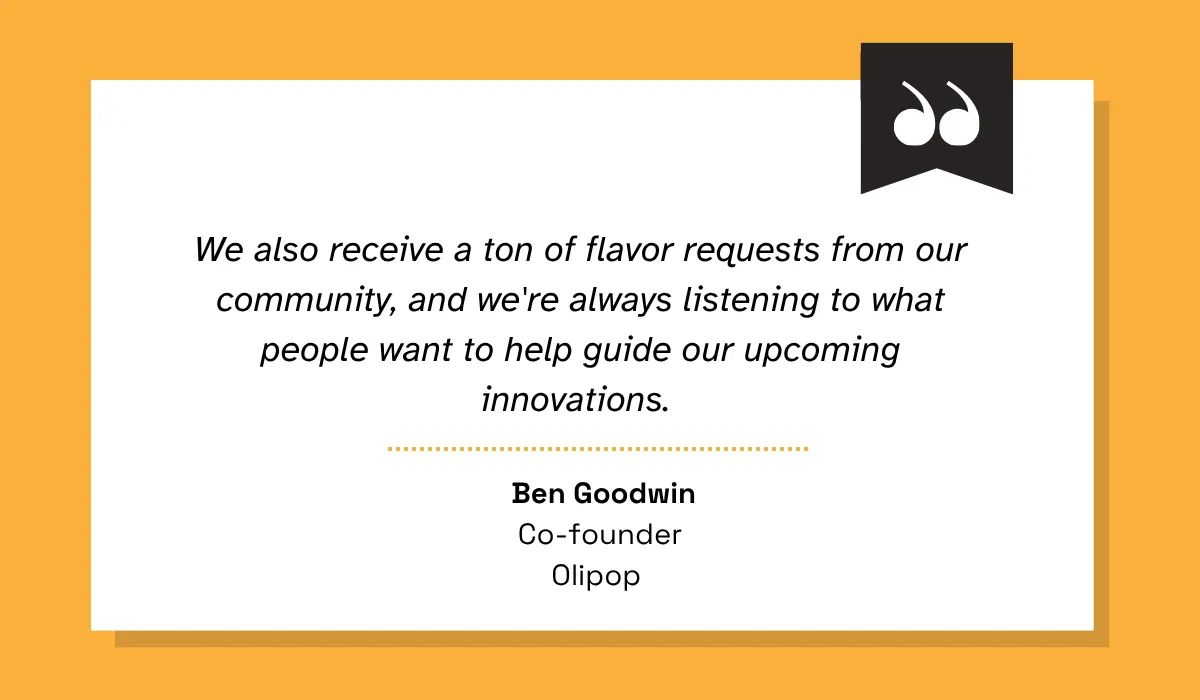
Illustration: Veridion / Data: Ben Goodwin
Olipop didn't guess its way into a $400 million brand.
Each signal fed the next: search told the founders a category was forming, repeat purchases confirmed people would pay for it, and flavor requests told them exactly what to build next.
When they all point in the same direction, that's your sign to commit. You can put a roadmap or budget behind that specific theme now. But when only one of the three shows up, it's still worth watching, not worth funding yet.
Competitor Strategic Moves
How many of your competitors announce their pivot beforehand?
Almost none, which means if you're not watching where they're headed, you'll only notice it when their moves begin to directly impact you.
By then, it is too little too late, and more reason why you need to pay attention to whom they're hiring, what they're charging, and how they're talking about themselves.
You’re going to be competing with other companies in 66% of software sales, so you need to be prepared for the playing field to change.
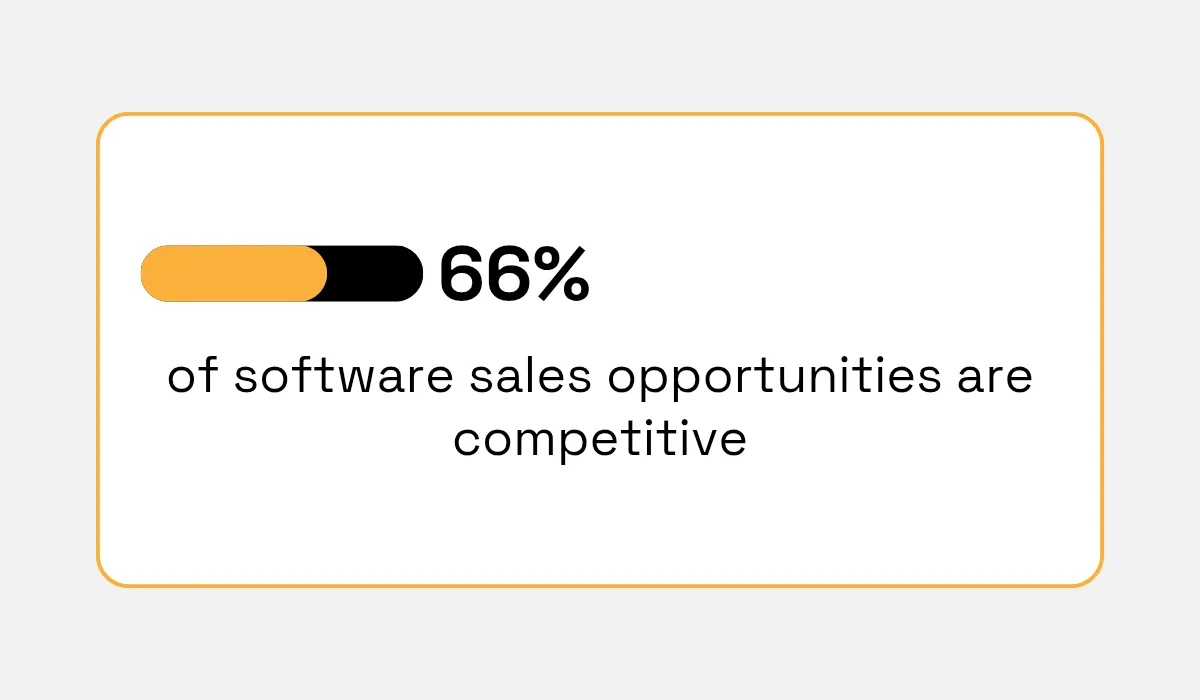
With that much of the market now genuinely contested, how prepared will you be when you do come across them?
To be more prepared when you meet them, focus on convergence.
This means paying attention to specific patterns in the things they do that all point towards the same direction.
Watch for specific patterns in their hiring, pricing, announcements, and messaging.
Hiring patterns are one of the most honest signals available, because a job posting has to be accurate enough to attract the right candidate.
A company can put whatever spin it wants on a press release, but it can't afford to be vague in a job description without wasting its own recruiting time.
If they have ten senior engineering roles clustered around a specific technology, or a sudden wave of enterprise sales hires in a region they've never operated in, that tells you where they're placing their bets.
From there, their pricing moves focus more on the timing of the price change, not the price itself.
When your competitor suddenly increases or reduces their permanent price, this shows that they’re:
- Chasing volume
- Recalculating their position
- Trying to cut down on losses
- Switching their target audience altogether
The first two arechasing must determine whether itr chactivelylume or repositioning is actmerelycoming after share, likely yours.
So, pull your lost-deal reports against them from the last two quarters and see which segment you're losing most and where they're getting the edge over you since that's how you'll build your defence angle.
The last two are defensive. Them cutting losses or abandoning a segment is retreating, so you don't need to match their price at all. If they're pulling out, that's opening up for you to move faster and gain more ground.
Messaging and expansion announcements also follow the same logic.
They are the most controlled signal a competitor gives you, and that's exactly why they're worth less on their own.
By the time a press release goes out, legal, PR, and leadership have already agreed on one version of the story to tell the public, so the announcement is never random. When a competitor announces expansion into a new region, their recent hiring in that region also reflects that.
If both check out, the region they're entering is about to get more expensive to compete in.
That's your window to watch out for this region or strengthen your brand's awareness there.
But competitor moves are often driven by a deeper force underneath, where technology spending in a category is starting to move.
By the end of a quarter, you should be able to answer one question with these signals: is this competitor coming after your accounts, or retreating from ground you can now take?
Whatever answer you decide on determines if your next move is a defensive push to protect what you have, or an offensive one to go claim what they're leaving behind.
Technology Adoption Trends
When a technology trend shows up in a competitor's product announcement, most of the market has already gotten accustomed to it.
Businesses worldwide are projected to spend $5.61 trillion on technology in 2025, according to Gartner's January 2025 forecast, which is up 9.8% from the year before.
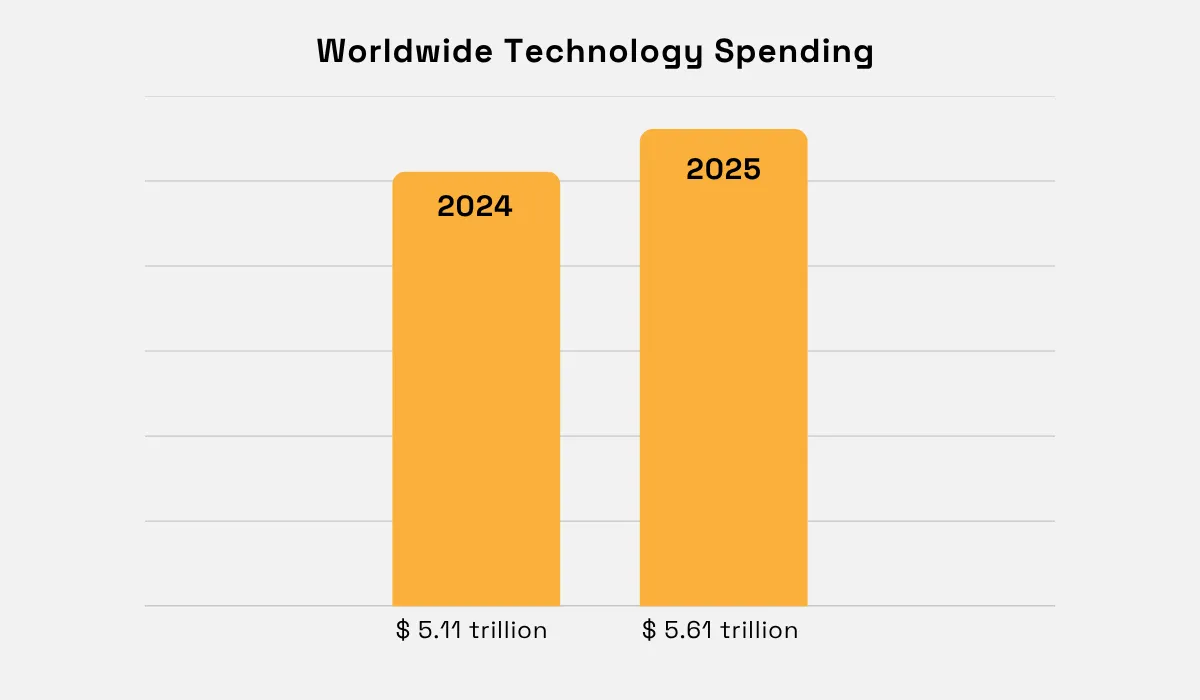
That amount of money does not move all at once. It moves category by category, technology by technology, per year before the outcomes show up in market share numbers.
While it moves, the market adopts the new technology slowly, with a small group of early buyers testing something new before most of the market knows of it.
This period lasts for a while before getting to a tipping point where it speeds up fast as the majority of the market catches on.
This is why category-level tracking matters more than tracking any single deal.
Technographic data platforms, such as HG Insights or BuiltWith, track what software and infrastructure thousands of companies have installed, and when they installed it, then aggregate that into adoption curves by category.
This way, you can see what percentage of companies in your industry have adopted that category of tool this year versus last year, and if that adoption is accelerating or leveling off.
That shows if the early trend is still worth getting ahead of, or one that's already peaked.
Snowflake, a cloud-based data and AI platform, took good advantage of this.
Its founders, Benoit Dageville and Thierry Cruanes, spent over a decade as data architects at Oracle, watching cloud computing mature while enterprise data warehouses stayed locked into rigid, on-premise licensing.
In 2012, they left to build a warehouse designed for the cloud from the ground up, betting that customers would rather pay for the computing they actually used than license a fixed amount upfront.
That model caught on because it solved a real cost problem. Under fixed licensing, a company pays the same price whether it uses the system constantly or barely touches it for months, so buyers were essentially pre-paying for capacity they might never use.
Usage-based pricing removed that risk entirely; customers only paid when they ran a query, which made the cost predictable and tied directly to actual value received.
That bet is still paying off. In the quarter ending April 2026, Snowflake's revenue grew 33 percent year-over-year, continuing a steady climb from 30 percent two years earlier.
The significance goes beyond Snowflake's own growth.
Once customers experienced paying only for what they used, fixed-price competitors became harder to justify, forcing much of the software industry to introduce usage-based tiers of their own just to stay competitive.
That adoption curve is what should decide your own timing. Once you spot it early, you can adapt early and build on an advantage before competitors catch up.
Geographic Expansion Signals
You've been watching what customers want, what competitors are doing, and where technology spending is moving. The last place all of this eventually points to is the exact region on a map.
Certain regions offer different benefits and networks for different industries.
Take Texas, for example; it has no income tax, which stretches a tech salary further without raising an employer's cost, and Texas has paid out more than $878 million in relocation and expansion grants through its Enterprise Fund, with a significant share directed at Austin specifically.
That alone has pulled in a lot of tech companies over the decades, including Oracle, Digital Realty, Apple, IBM, and Meta.
Digital Realty, a global data center company’s Chief Executive Officer, A. William Stein highlights this reason during their move:

Illustration: Veridion / Quote: PR Newswire
Decades of these anchor companies coming in also built a deep local talent pool, so employees can switch jobs without relocating, keeping skilled workers in the region even after the company that first brought them there.
That's the real worth of geographic expansion.
When your own industry's companies start clustering in a specific city, that's where hiring gets easier for everyone already there, and harder for you if you're trying to recruit the same talent from outside it.
A geographic expansion follows a pattern you can watch.
It starts small: a company opens an office in the region, testing the waters before it has any real customer base there.
Then, other companies in your industry are doing the same thing in the same city around similar times.
The next stage confirms it. A company converts their small office into a regional headquarters or a major operations center, showing that the demand there isn't experimental anymore.
When you spot that kind of clustering, you need to find what's actually pulling companies there in the first place.
That usually comes down to a specific, checkable incentive. It could be a tax advantage, a state or local grant program, a lower cost of living, or a university system feeding a steady supply of trained workers into that industry.
Texas's combination of no income tax and its Enterprise Fund grants is one example, but every region has its own version of this.
If the incentive is real and durable, like a permanent tax structure or an established university pipeline, the clustering is likely to keep compounding. So you can expand there as well, since hiring in that region is still cheap and competition for the same talent pool is thin.
If it's a temporary subsidy or a one-time grant program, the companies chasing it may not stay once it runs out, and the cluster could be smaller and shorter-lived than it looks right now.
Turning Signals Into Planning Input
The four different signals to track are a lot easier said than done, especially when each one comes from a different source, is updated on a different schedule, and is in a different format.
A search-trend dashboard doesn't have a hiring-data feed, nor does a spend report know what a facility announcement means.
These raw signals scattered around add up to a pile of tabs that doesn't tell you the full picture.
This problem gets worse at scale. If your strategy team is tracking even a handful of competitors across four signal types, they’re juggling dozens of disconnected data points a week.
By the time someone manually pulls it all into one place, cross-checks it, and turns it into something a leadership team can act on, the signal has often gone stale or a competitor has already moved on it.
What makes this process easier and turns that data into something you can plan around is structure.
A structure that takes these same four signals, but organizes them at the company level, and refreshes often enough that you're not planning around information that was already out of date when you pulled it.
That structure can be done with Veridion.
Veridion is a business data platform that builds and maintains structured profiles on companies worldwide.
Its database covers 186M operating companies, resolved against 461 attributes per profile and spanning:
- Technographics
- Growth indicators
- Geographic footprint
- Demand-adjacent signals
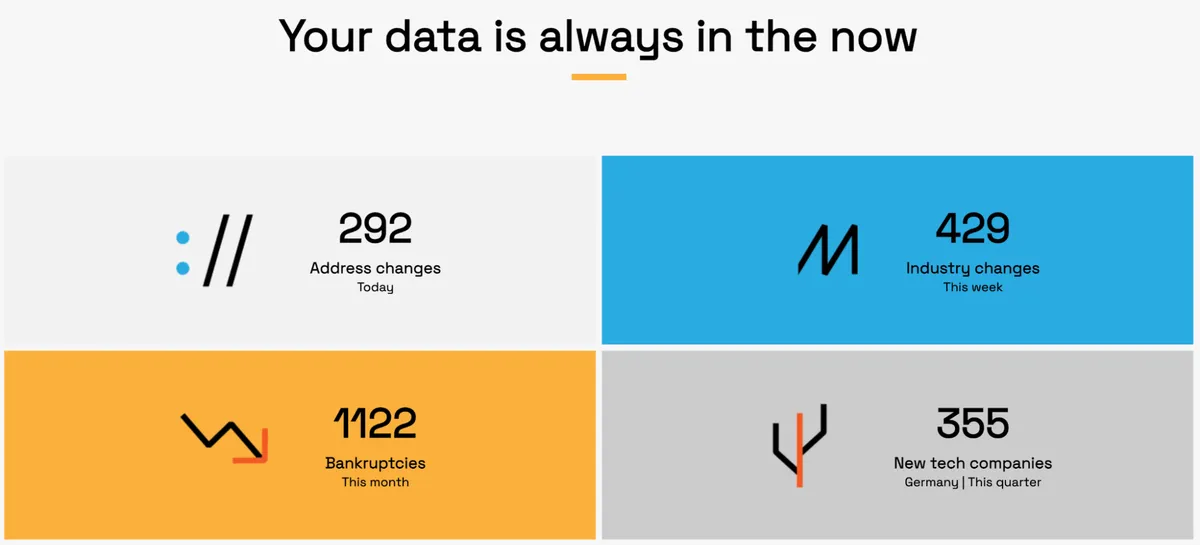
That data is refreshed continuously and is sourced from companies' own digital footprints, public filings, and registry data.
Source: Veridion
Instead of manually pulling a demand signal from one source, a hiring signal from another, and a facility expansion from a third, you work from one structured foundation that already connects everything to the same company record.
Conclusion
Market signals become valuable only when they're connected, structured, and viewed in context.
Customer demand, competitor activity, technology adoption, and geographic expansion each tell part of the story, but together they provide a clearer picture of where your market is heading.
By building your planning process around consistent, high-quality signals instead of isolated data points, you can make decisions with greater confidence and respond to change faster than others.
Articles
Discuss how these trends affect your organization.
Our analysts are available for a short call. Bring a specific question and we will ground it in the data.
Insights
Keep reading
More analysis, research, and outcomes grounded in live company intelligence.
M&A Target Radar: Spotting Acquisition and Partnership Signals in Real Time
Are you missing crucial market signals for strategic planning? M&A Target Radar helps you spot acquisition and partnership opportunities in real time.
9 Essential Sources of Market Intelligence
Want to boost your market knowledge? These 9 market intelligence sources will show you where to look and how to apply the insights.
Best Practices for Leveraging Market Intelligence
Not sure how to apply market intelligence effectively? Learn which practices top businesses rely on and how you can too.