Insights / Articles
How to Build an Ideal Customer Profile Using Firmographic Data (Step by Step)
Tired of guessing who your ideal customers are? Master building your firmographic data ICP with our step-by-step guide.

- Your ideal customer profile comes from your CRM, not your assumptions.
- Markets shift, so the profile that worked last year may not hold up today.
- Turning an ICP into a live search query changes how fast you can act on it.
- Use firmographic data tools to scale and update your ICP.
Most B2B organizations can provide detailed information about their product, but few can quantify which companies need to purchase it.
Salespeople waste so much time working with accounts that will never be qualified, and marketing teams create lookalike lists that don't look alike at all.
An ICP (Ideal Customer Profile) closes that gap, but only when you build it from data you already have, not from a mental picture of who you wish your customers were.
In this guide, we show you how to define and use firmographic filters to build a powerful ICP.
Let's dive in.
1. Pull Your Top Customer List First
Every accurate ICP begins with a list, not an assumption. Start by pulling your best current customers, ranked on several metrics.
This is vital because "best" may mean different things to different organizations. And using one metric skews the list toward big, unhappy accounts.
Start by pulling your best current customers, ranked on more than one measure. Revenue alone tells you who pays you the most, not who stays, refers others, or gets maximum benefit from your product.
A large account that pays well but has a 1-year contract is not a template worth repeating.
This is because in B2B software, a company does not recover its customer acquisition cost until around 16 months in. A customer who leaves before then didn't just fail to grow your revenue; you likely never recovered what it cost to win them in the first place.
Bain and Company's research on the Net Promoter System found that the lifetime value gap between detractors and promoters typically runs three to eight times.
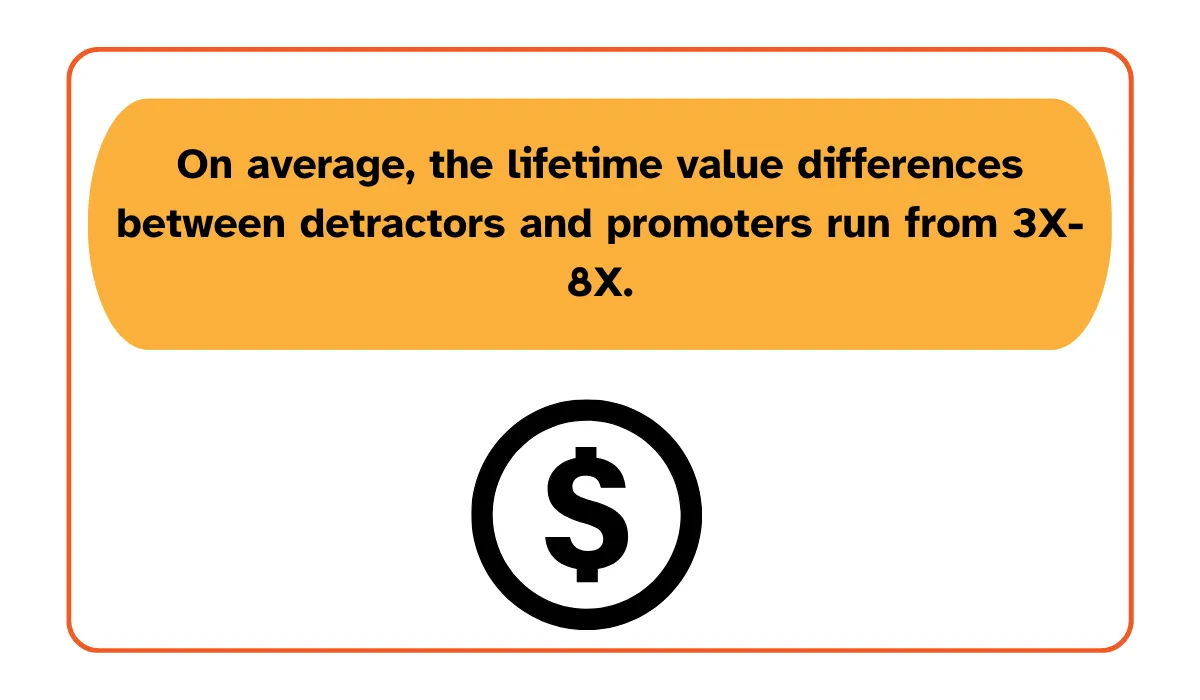
Illustration: Veridion / Data: Bain and Company
That gap never shows up in a revenue-only ranking. It shows up once you add a loyalty or satisfaction measure to the mix.
Rank accounts by a blend of metrics such as annual contract value, renewal/retention rate, expansion or upsell revenue, and satisfaction indicators like NPS or referrals.
This ensures you're capturing true success stories, that is, the customers who bring the most value and loyalty.
How large should your list be?
A practical rule of thumb is to aim for at least 20–50 top customers and rank them by revenue, retention, and Net Promoter Score, for analysis. This range is wide enough to reveal a real pattern but small enough to analyze by hand.
If your company is smaller, use what you have—just be aware that very small samples can lead to coincidence rather than insight.
Pull this list from your CRM first, since it holds your win-loss and revenue history. Cross-check it against your billing or finance system, which tells you who actually pays on time and expands their contract. Then layer in your customer success platform for renewal and NPS data.
When the three sources disagree, for example, your CRM shows a client as closed-won, but billing shows they never converted to a paid plan, trust the system that reflects real transactions over the one that reflects sales activity.
Once you have your top list, keep it accessible to the whole team. Sales, marketing, and customer success should agree on this "best of" list, since each can provide context on why these customers win.
2. Identify the Common Firmographic Patterns
With your best-customer list in hand, look across those accounts to spot patterns in firmographic traits. These are company-level attributes:
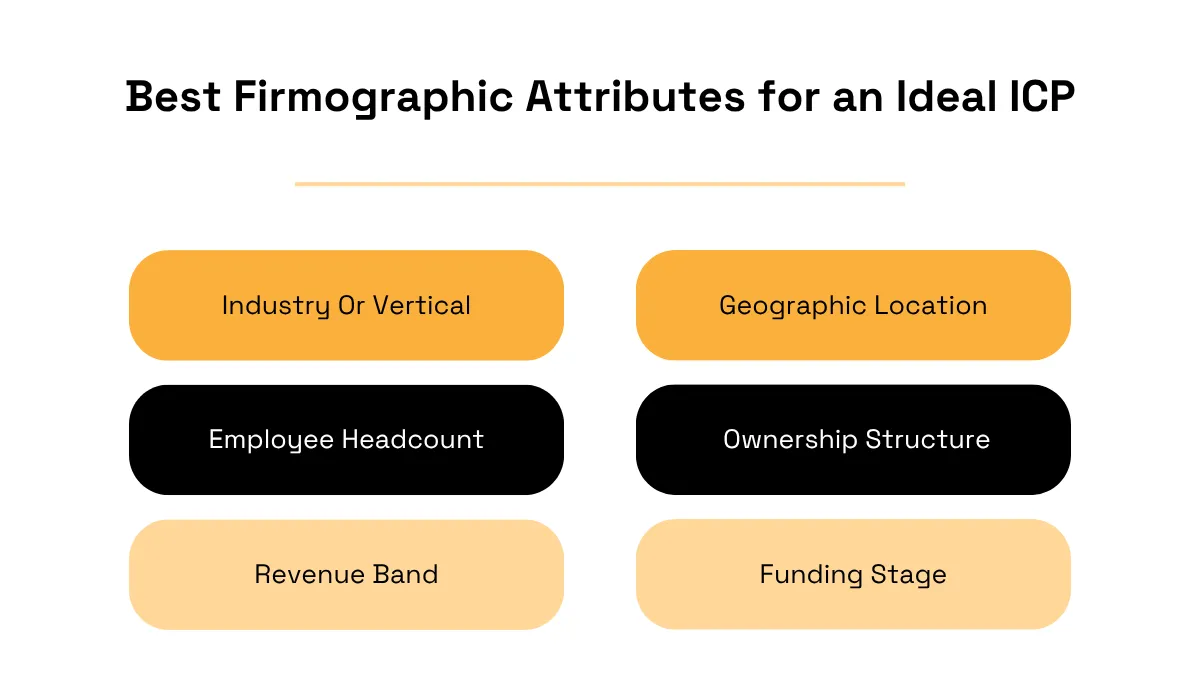
Illustration: Veridion
These predict fit better than surface-level traits because they describe the operational reality of a company.
An organization's size and ownership structure often determine its budget authority, procurement process, and urgency to buy.
A sharp ICP goes beyond basic filters to pinpoint industry sub-segments, company scale, geography, and funding stage, since patterns at this level separate genuine best-fit wins from everything else.
Additionally, pairing firmographics such as company size and geography with technographic signals like the tools a company already runs gives you a more powerful ICP. This is especially beneficial for tech products, since tech companies tend to have different buying patterns than retail firms.
Edward Moores, a former data strategy manager at Sage, a business solutions provider, found that layering technology-stack detail on top of basic firmographics roughly quintupled the conversion rate to opportunity for matching accounts.
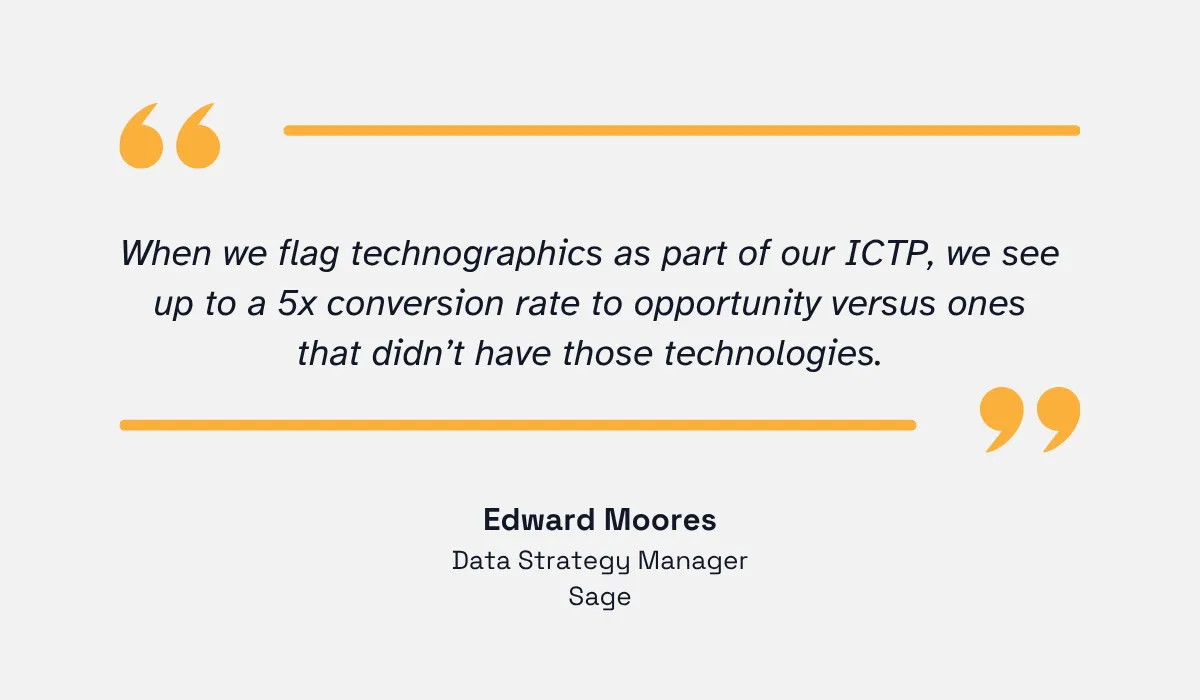
Illustration: Veridion / Quote: HG Insights
That is a useful reminder that it is worth testing which of your attributes actually correlates with a win, not just which ones happen to be easiest to collect.
If your top customer list does not show one obvious pattern, do not force it into a single profile. Recognize instead that you may have two or three distinct ICP segments hiding in the same list, each with its own set of firmographic traits and its own messaging.
For instance, your "best" customers might split between large enterprises in one sector and nimble mid-sized firms in another. In that case, it may be worth defining two separate ICP segments (as long as they truly have different criteria) rather than forcing one profile to cover both.
Also write down the outliers (the customers who do not fit the emerging pattern), rather than discarding them. An outlier could point to an edge-case market or future opportunity.
For example, if most top customers are in Germany but one outlier is in Australia, ask why. Maybe you have a budding opportunity there. But for now, focus on the common traits for your core ICP.
Build this comparison in a simple spreadsheet, one row per account and one column per attribute, then tally how often each value repeats.
Start with the fields you already have clean data for; industry and location tend to be the most complete fields in any CRM. Move to harder ones like ownership structure or growth stage next, since those often need outside enrichment to fill in.
A pattern that shows up across most of your top 20 to 50 accounts is worth writing down. One that shows up in two or three is probably a coincidence.
3. Turn the Pattern Into a Written ICP Definition
A pattern is not a definition until you put real numbers on it. Once you know which firmographic attributes repeat across your best accounts, write the definition down with actual ranges, not adjectives.
This means using specific numbers and categories, not vague terms. For example, instead of writing "mid-sized companies", define "companies with 50–200 employees." Instead of "tech companies," say "B2B SaaS or IT services" (with appropriate codes or taxonomy if possible).
Precision matters because a broad ICP is useless. If you say "all technology companies," that could be tens of thousands of firms. In a survey of more than 300 sales leaders by The Science of Scaling, 28% named targeting too broadly, too early, as their organization's single biggest ICP mistake.
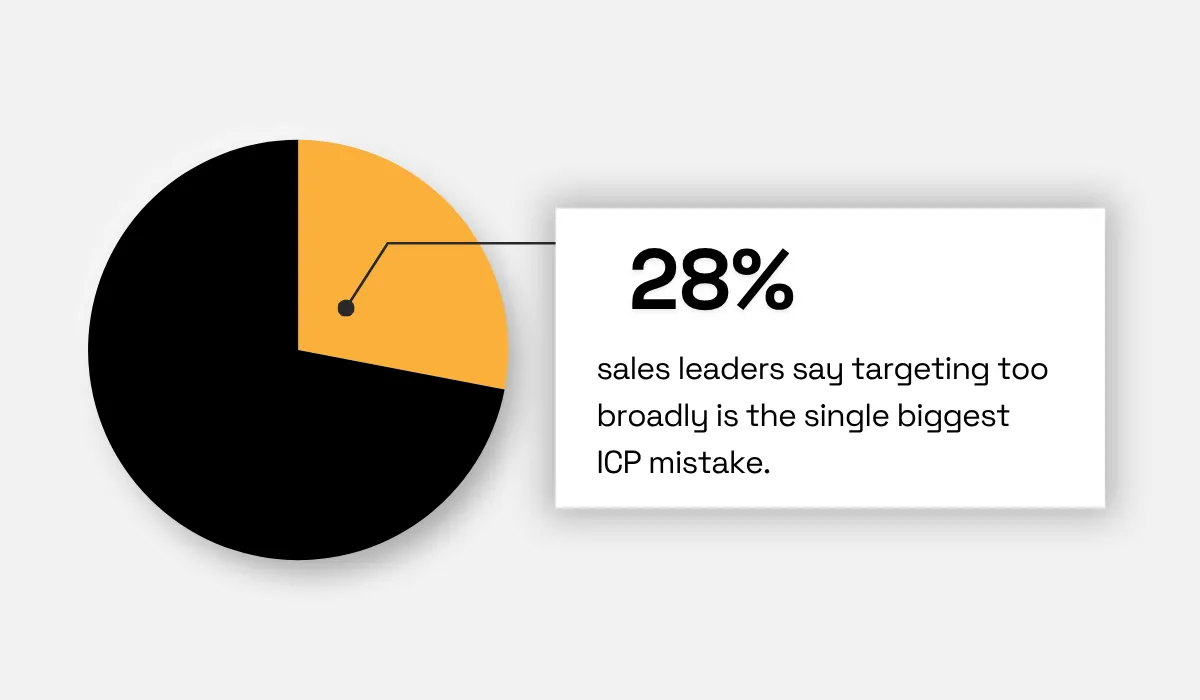
Illustration: Veridion / Data: The Science of Scaling
Vague definitions fail in both directions. Too broad, and you waste outreach effort on accounts that were never going to convert. A definition spanning 50 to 5,000 employees across any industry is not a filter but a description of the general economy.
If your definitions are too narrow, you shrink your addressable market past the point of being useful.
In short, a profile needs to be detailed enough to guide real decisions, but not so restrictive that it rules out legitimate expansion.
You can easily achieve this if you include ranges or lists for each attribute. A sample ICP definition might look like:
Attribute | ICP Criteria |
|---|---|
Industry | Healthcare; Financial Services |
Headcount | 100 – 500 employees |
Annual Revenue | $5M – $50M |
Geography | United States (North America) |
Ownership/Growth | Private or VC-backed; Series B or later |
Notice all fields are specific ranges or categories. This is far more actionable than "mid-sized healthcare companies." Each attribute corresponds to data points you can filter on.
Also resist the temptation to have too many ICP versions. One or two profiles is a good limit for most organizations. Having five or six so-called ideal profiles often signals confusion about your target market or an overly broad product scope.
Pick the one or two segments that made your best customers successful, and treat the rest as secondary until you have data to support them.
Once the definition is written, run it past sales and customer success before you call it final. They talk to these accounts every week, and they will tell you quickly if a number on paper does not match what they see in real deals.
4. Operationalize the ICP With Firmographic Data Tools
A written ICP is just theory unless you put it into your systems. Operationalizing the ICP means turning those criteria into actual filters and queries that can run on company databases.
In practice, this is where a firmographic data platform like Veridion comes in.
Every field in your definition needs to map to a data attribute before it becomes searchable. Revenue range maps to an estimated revenue filter while industry maps to a classification code. Geography, on the other hand, maps to a location filter, and employee count maps to a headcount range.
Veridion's Search API makes this process easy. It can translate your ICP definition directly into filters like industry, business category, product or service keywords, employee count, and location, and combine them with boolean logic to return a live list of companies that match.
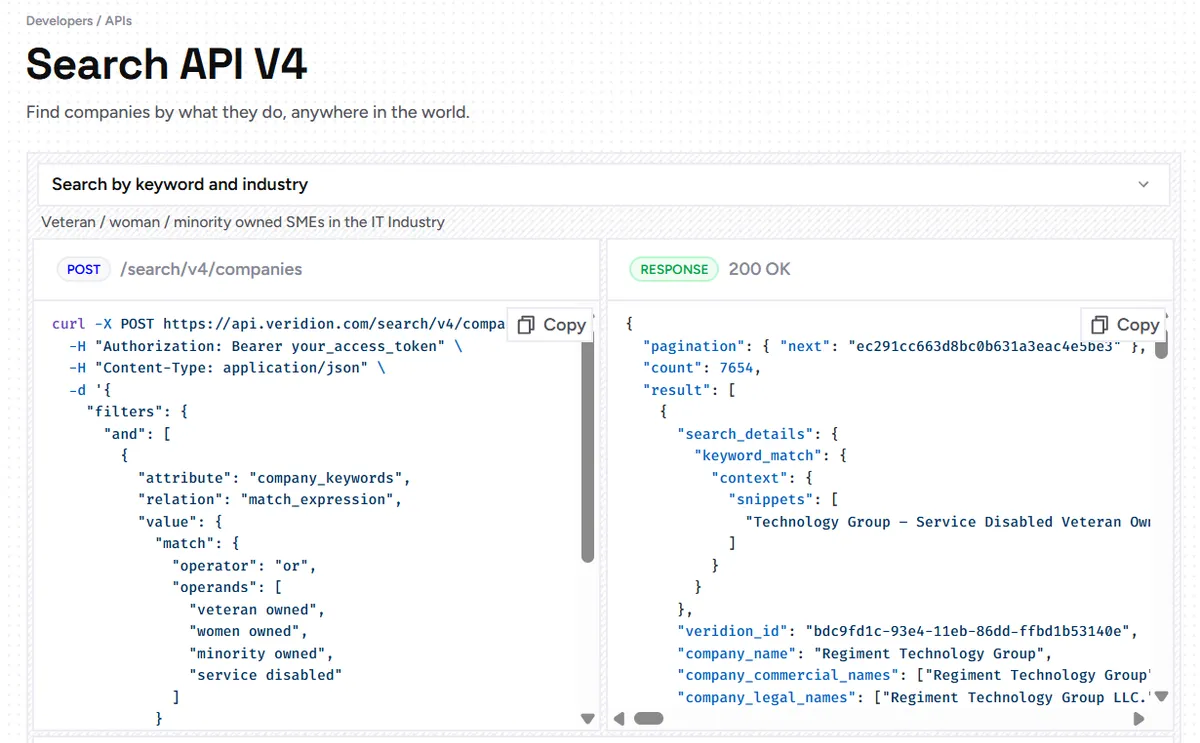
Source: Veridion
Our API runs searches across industry classifications, business tags, and text extracted from a company's own website to confirm the fit. So a well-built query returns a working list rather than a handful of names you already knew.
For accounts you already have, the workflow runs the other way. Our Match and Enrich API takes whatever identifier your CRM record carries (a name, a domain, a registered address, etc.), and appends a full firmographic profile back onto it.
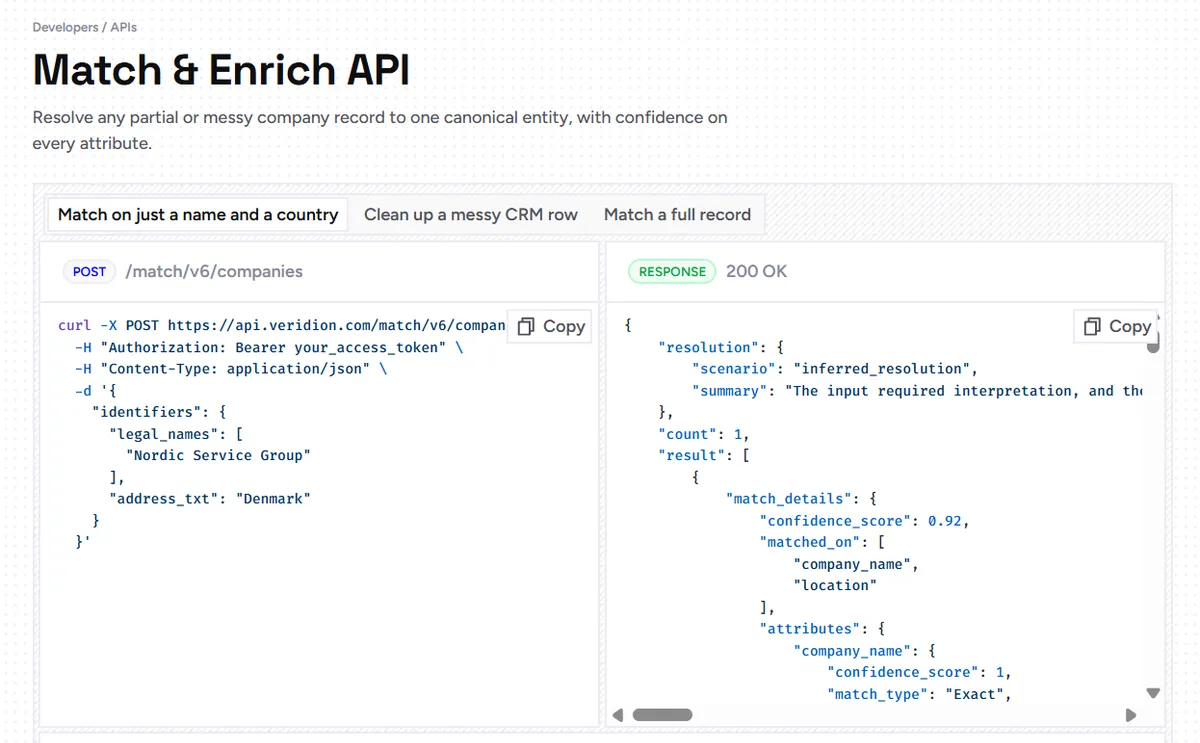
Source: Veridion
Veridion pulls over 461 attributes, each with its own confidence score and source URL. This confidence score tells you how reliable that data is.
Our platform returns rates above 95%, with the confidence on each individual field driving whether it auto-merges into the CRM, routes to a review queue, or gets flagged for a human to check by hand, rather than silently overwriting good data with a bad guess.
With Veridion, your sales or RevOps team now has the tools to automate ICP matching at scale.
Build your ICP filters into your campaign tools and CRM segmentation. That way, leads can be automatically scored by ICP fit, and reporting can track how well your pipeline aligns with the profile.
This tight integration is what makes your ICP definition actionable rather than just a slide deck.
5. Validate and Refine the ICP on a Quarterly Cadence
An ICP is not a document you write once and file away. Markets shift, products change, and your customer base evolves, so your ICP needs a regular checkpoint.
An ICP built from last year's data is already going stale. As Victoria Wallace, senior content strategist at Chatter Buzz Media, a performance marketing agency, puts it:
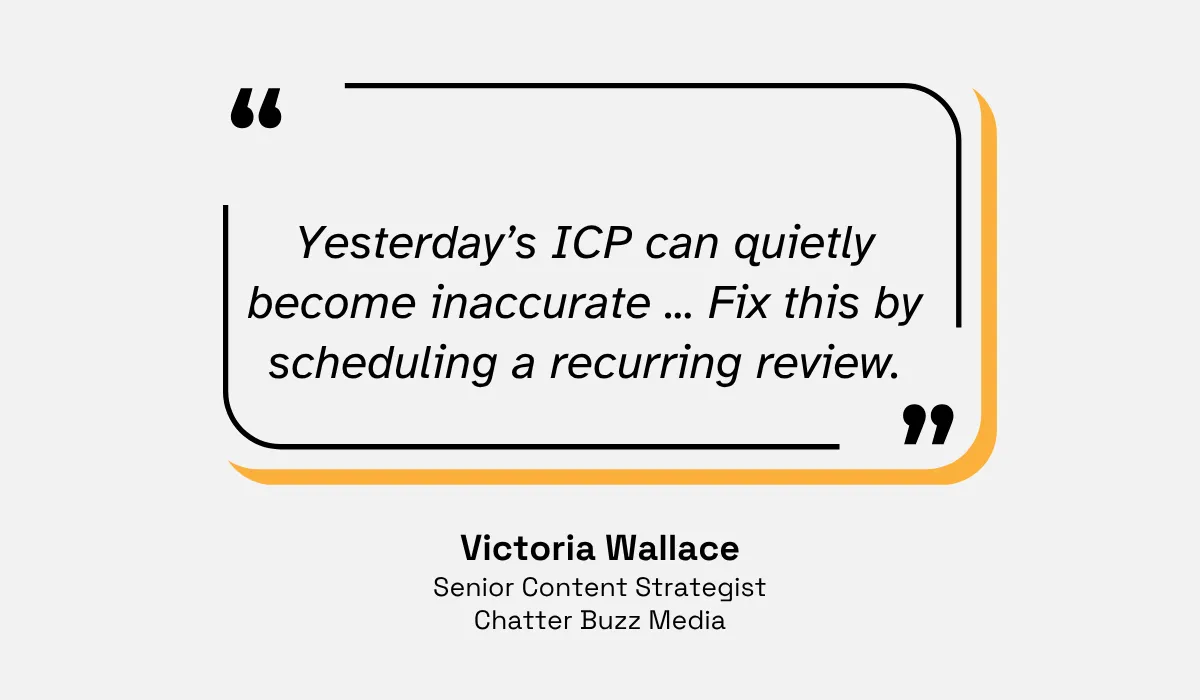
Illustration: Veridion / Quote: Chatter Buzz Media
To keep your ICP fresh, you need a regular review process, typically every quarter. This gives you enough new closed-won and churn data to detect a real shift without overreacting to a single anomalous deal.
Beyond the calendar, specific events should trigger an off-cycle review regardless of where you are in the quarter.
This could be a new product launch that changes who benefits most from what you sell, an acquisition that changes your capabilities, or a noticeable shift in your win and loss pattern.
If your win rate on accounts that technically match your ICP starts dropping, that is a signal worth investigating immediately rather than waiting for the next scheduled quarter.
Validating the ICP concretely means re-running the same top-customer analysis you did in step one, using your latest closed-won, retention, and NPS data, then checking whether the original pattern still holds.
Below is a simple quarterly cycle for ICP validation:
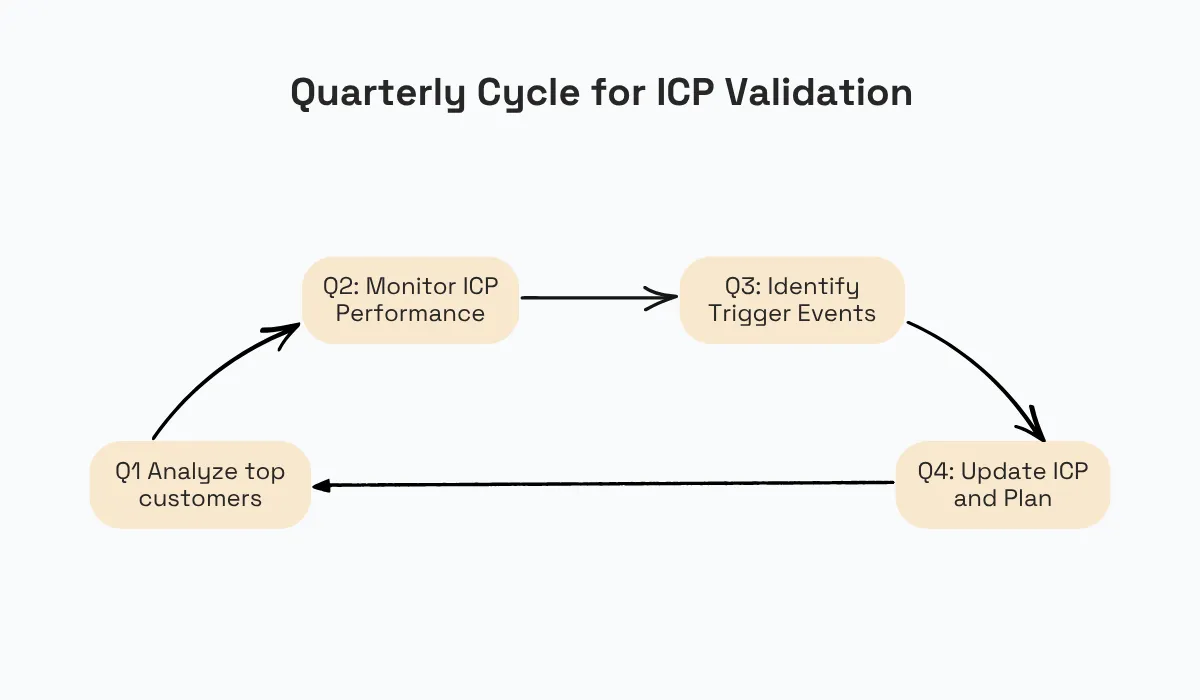
Illustration: Veridion
Each quarter, gather fresh data (Q1), check how ICP-fit accounts are performing (Q2), watch for market/product triggers (Q3), and adjust the ICP (Q4). Then repeat.
You will know your ICP has gone stale when you see win rates dropping for accounts that fit the profile on paper, or when an increasing share of your best customers by revenue and retention start falling outside your current definition.
Treat every tweak as an incremental step. Minor tweaks to the revenue range or geographic area—using up-to-date information—will ensure the ICP is still correct without requiring your sales and marketing department to learn an entirely new ICP each quarter.
Following this cadence keeps your sales and marketing efforts focused on the right prospects. This prevents wasting effort on inappropriate markets.
Conclusion
A well-developed ICP built with firmographic data helps optimize every stage of your sales process. By following the above five steps, you create a feedback loop that continuously improves targeting.
Skip any one of those steps and the profile drifts back into guesswork. Do all, and every team from marketing to sales to customer success starts working from the same, current picture of who your product actually serves best.
Remember, the goal is to spend more time with customers who are the right fit, and less time and budget on everyone else.
Articles
Discuss how these trends affect your organization.
Our analysts are available for a short call. Bring a specific question and we will ground it in the data.
Insights
Keep reading
More analysis, research, and outcomes grounded in live company intelligence.
Best Data Intelligence Platforms
In this article, we compare six leading platforms, covering what the tool does, who it suits, plus its features, pros, and cons.
What is a Match Score? Understanding the Waterfall Methodology in Company Data Enrichment
Tired of inaccurate company data? Understand the data enrichment API match score and fuzzy company name matching with the Waterfall Methodology.
Data Attributes That Make Risk Models Smarter Than Basic Firmographics
Tired of basic firmographics? See how advanced data attributes help you identify emerging market risks and build smarter, more resilient risk models.