Insights / Articles
How to Integrate a Company Financial Data API into Credit Risk Models
Connecting a company financial data API to a credit risk model takes entity matching, period alignment and point-in-time snapshots.

- Accurate financials can still describe the wrong borrower.
- Updated figures can make past predictions look better than they were.
- A successful pipeline run can still hide a major calculation error.
A financial data API can return a valid response and still feed your credit model the wrong inputs.
Integration thus takes more than a connection. You need a pipeline covering source selection, entity matching, normalization, period alignment, point-in-time handling, feature creation, validation, and ongoing refresh.
If you skip any of those stages, the error can stay hidden until it affects the final credit assessment.
Company intelligence providers like Veridion can support the entity-matching stage. They help you connect financial records to the right business.
Here are eight steps to get that pipeline right.
1. Select a Suitable Financial Data Source
Before you connect an API, check that its data can support the credit decisions you need to make.
A source could give you detailed financials for listed companies but leave gaps in the private businesses in your lending portfolio. Headline coverage won’t tell you if you can calculate the features your model needs.
So what should you check?
Selection criterion | What to establish |
|---|---|
Private-company coverage | Are the required financial fields available across your target company sizes, sectors, and jurisdictions? |
Available identifiers | Can you link records using stable provider IDs, registration numbers, or legal entity identifiers (LEIs)? |
Historical depth | Does the source cover enough reporting periods and distressed companies for your intended analysis? |
Point-in-time access | Can you retrieve what was available on a historical decision date, including earlier versions? |
Provenance | Can you trace values to filings or other sources and distinguish reported figures from estimates? |
Missing-value behavior | Does the API distinguish zero from unavailable, undisclosed, or inapplicable values? |
Update cadence | How quickly do new filings and corrections become available? |
Delivery options | Do endpoints, bulk exports, rate limits, and pagination support your workload? |
Delivery choices have practical consequences.
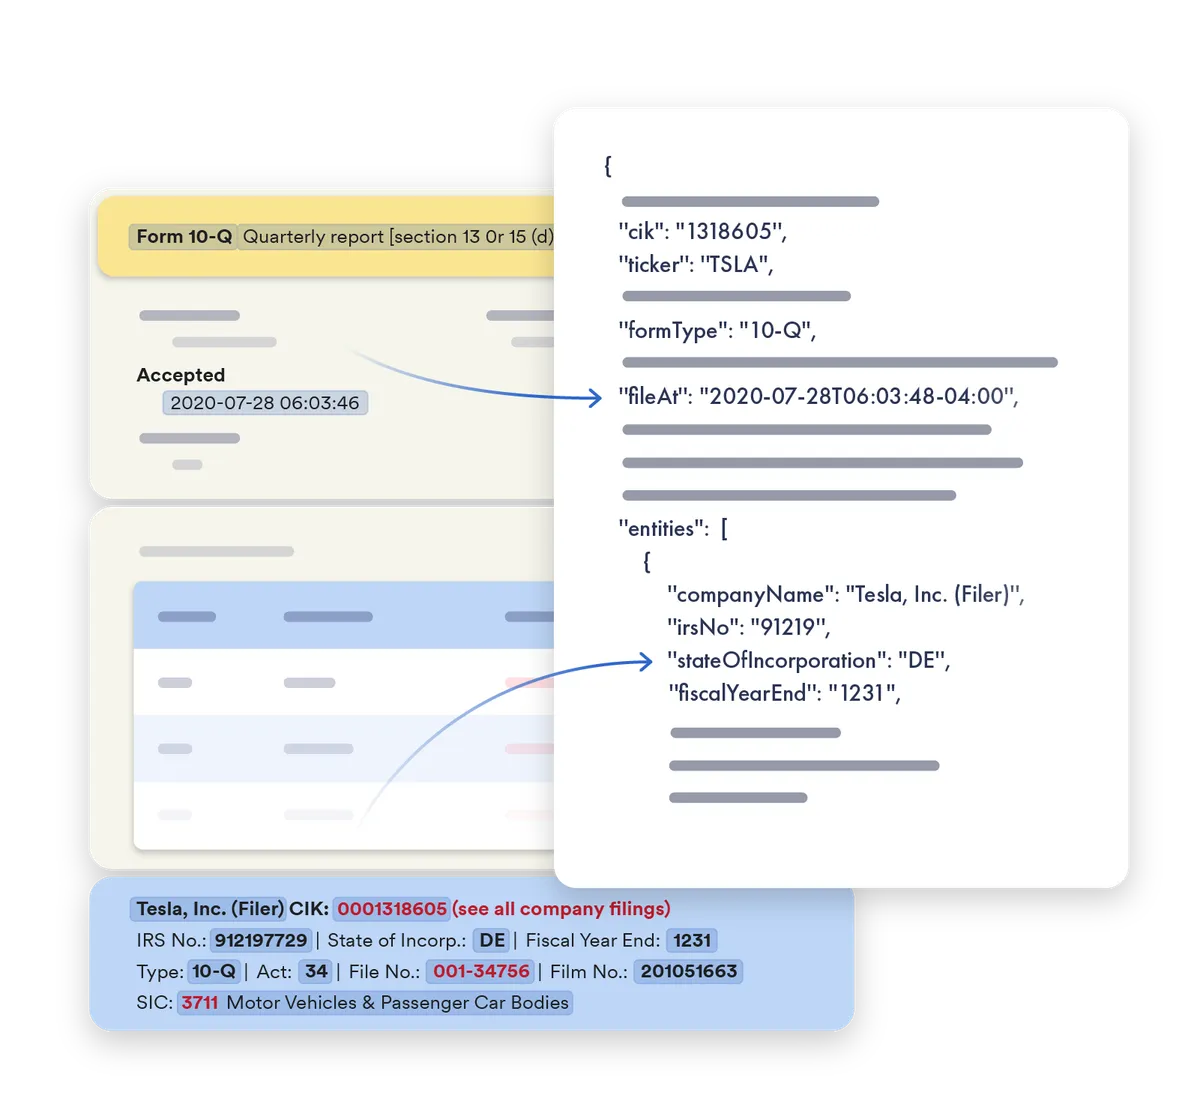
Take the U.S. Securities and Exchange Commission’s EDGAR APIs.
Source: SEC API
The APIs update throughout the day as filings are disseminated. But bulk archives are rebuilt nightly. That means you can load historical data from the bulk archives and pick up new filings through the APIs.
Before committing, test a representative borrower sample. That should include:
- Private companies
- Subsidiaries
- Historical defaults
And check if you can reconstruct the inputs for an actual past lending decision. Then, measure missingness and retrieval delays.
Now, you can tackle the next question: which company does each record actually describe?
2. Resolve Company Identities
Accurate financials can still produce misleading features if you attach them to the wrong borrower.
So before joining external records with internal data, establish which legal entity the statements describe and how it relates to the operating business. A familiar trading name or shared website isn’t enough.
Say you’re lending to a local subsidiary, but the financial data you pull covers its whole parent group. That means you end up judging the borrower’s ability to repay using earnings and assets it doesn’t actually have access to.
To avoid that, build a mapping between source identifiers and your internal company IDs, with explicit rules for common complications:
Trading names and name changes | retain aliases against a stable identity |
|---|---|
Subsidiaries | distinguish standalone accounts from consolidated group statements |
Duplicate records | merge confirmed duplicates without collapsing separate legal entities |
Acquisitions | date ownership links and preserve the acquired company’s historical identity |
Cross-jurisdiction entities | verify registration jurisdiction separately from operating location |
Use registration numbers or LEIs where available, and support them with addresses and other identifiers. Then, send ambiguous matches for review.
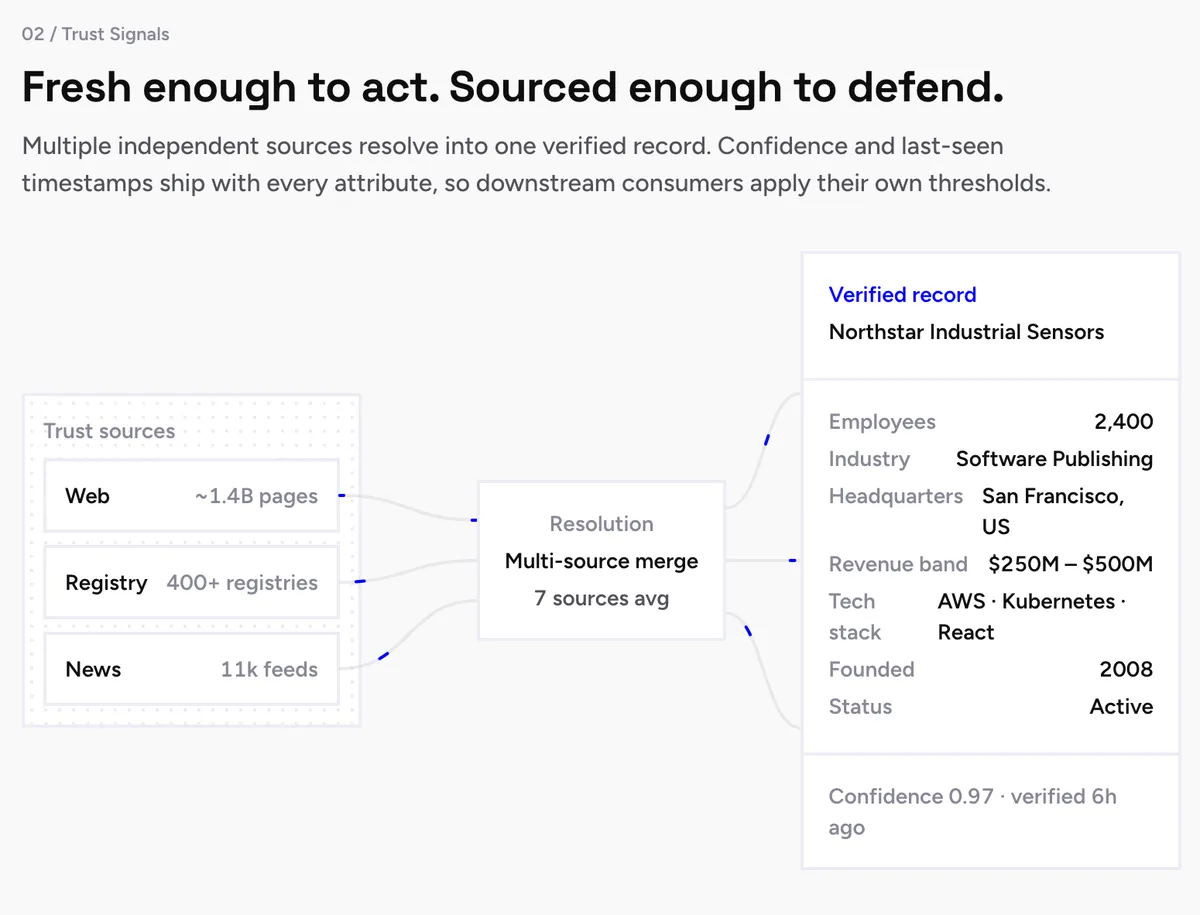
Veridion’s company intelligence layer can help you here.
Source: Veridion
Veridion gives enterprise data teams continuously updated company profiles. It connects legal records with:
- Digital footprints
- Business activities
- Locations
- Ownership relationships
One of the benefits of data enrichment is this added context. Those connections help you establish which business sits behind a name and distinguish it from similarly named companies or related entities.
Source: Veridion
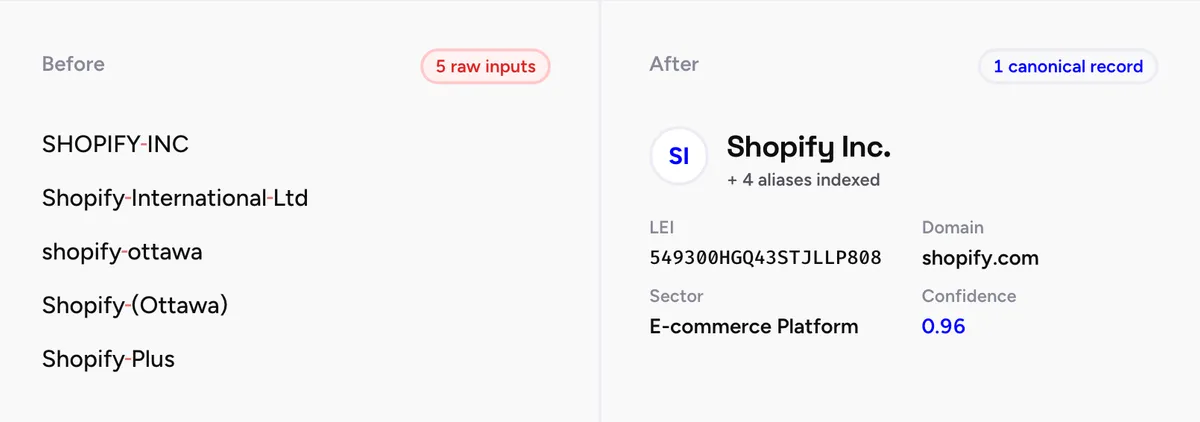
Veridion brings several independent sources into one verified record, with confidence scores and last-seen timestamps at the attribute level.
That gives your team a practical basis for setting acceptance thresholds and flagging uncertain or stale details for review before joining financial records.
And there’s a private-company coverage customer story to back this up.

Source: Veridion
A financial-intelligence platform added company profiles and operational signals through Match & Enrich while keeping its existing identifier system.
Veridion complements (not replaces) a financial data API. Company intelligence helps establish which business you’re analyzing. But it’s your financial data API that supplies the financial records.
With identities and reporting boundaries clear, you can now make the figures comparable.
3. Normalize the Financial Data
Two APIs can return a field called “revenue” with wildly different numbers.
One value can represent a full financial year in dollars. Another can cover six months in euros.
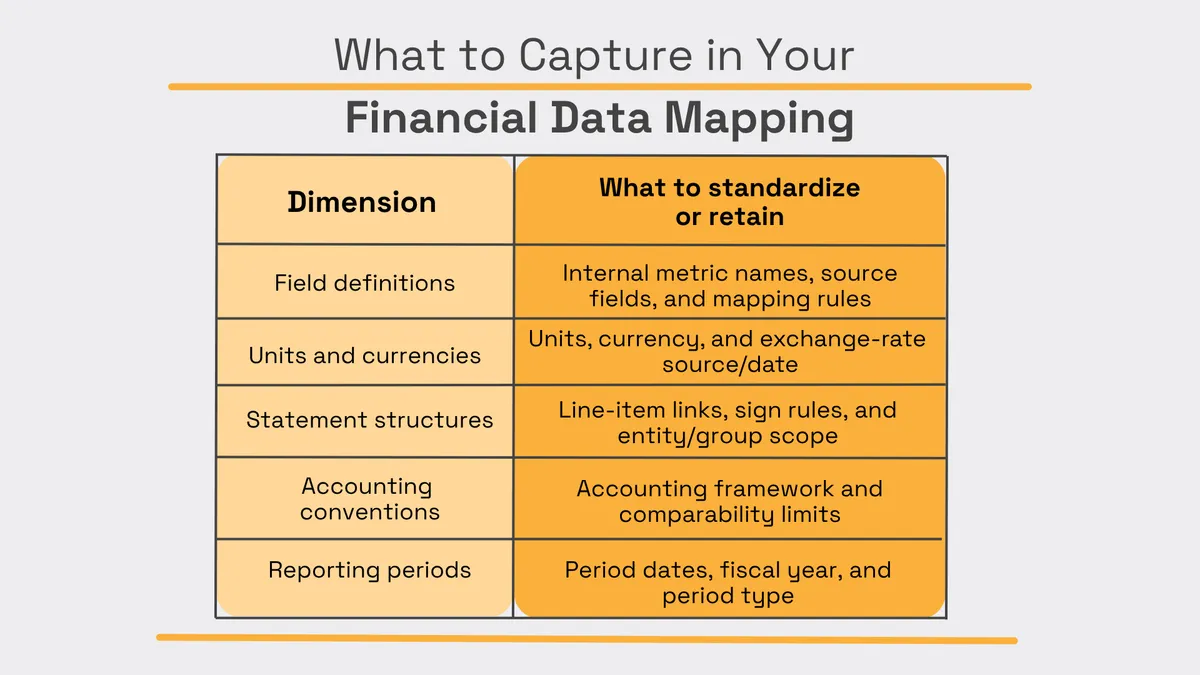
At this stage, map source fields into a documented internal schema. Keep the original values next to your normalized records, so you can trace each conversion easily.
Your mapping should capture:
Source: Veridion
However, just renaming fields won’t resolve accounting differences. Where definitions can’t be reconciled, flag the limitation.
And pay special attention to period alignment.
The SEC’s API documentation warns: “Data users should be mindful [of] different reporting start and end dates for facts contained in a frame.”
Take a company that reports six-month revenue of €12 million and first-quarter revenue of €5 million. You can derive second-quarter revenue of €7 million only if both figures use consistent accounting, consolidation scope, and reporting versions.
That subtraction works for a cumulative flow like revenue. But it doesn’t work for cash balances, which describe a position on a particular date.
So before calculating credit-risk features, make these final checks:
Check | Why it matters |
|---|---|
Compare equivalent periods | Six months of revenue isn’t comparable to a full year. |
Flag shorter or longer financial years | Extra reporting months can look like growth. |
Document annualization rules | Any conversion to a yearly estimate should be clear and consistent. |
These checks help you tell actual performance changes apart from differences in measurement.
4. Preserve Point-in-Time Snapshots
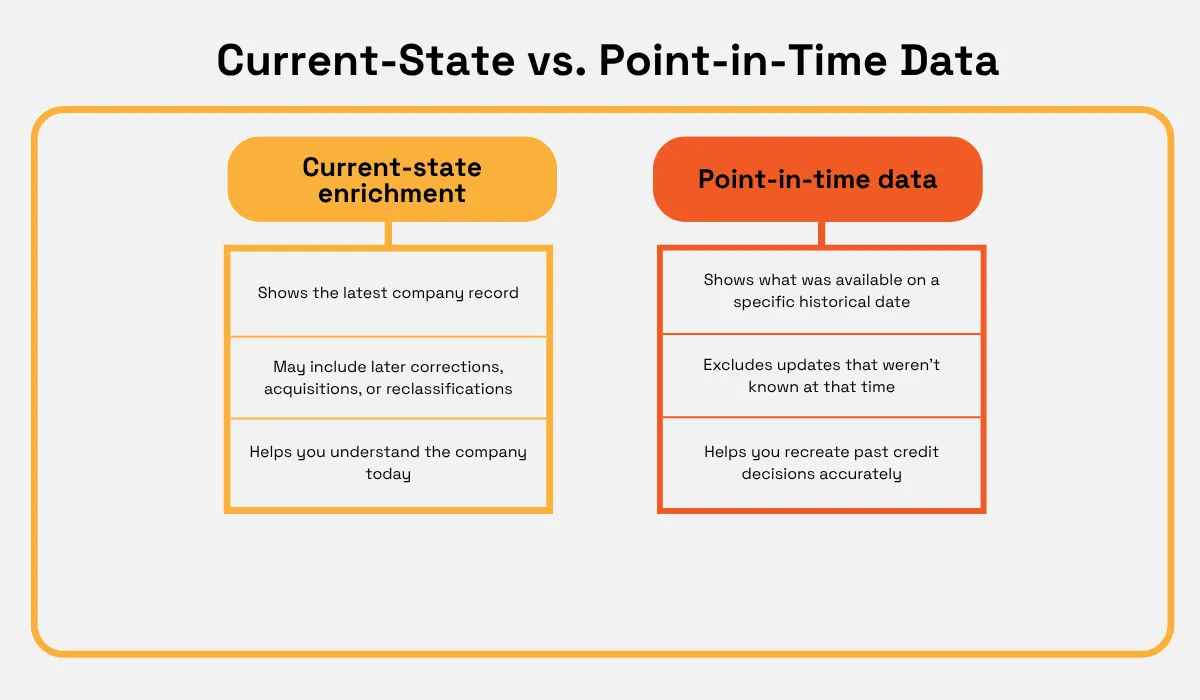
There’s a big difference between current-state enrichment and point-in-time model data. And it’s important to know it when you’re training or backtesting a credit model.
The visual below explains them side by side:
Source: Veridion
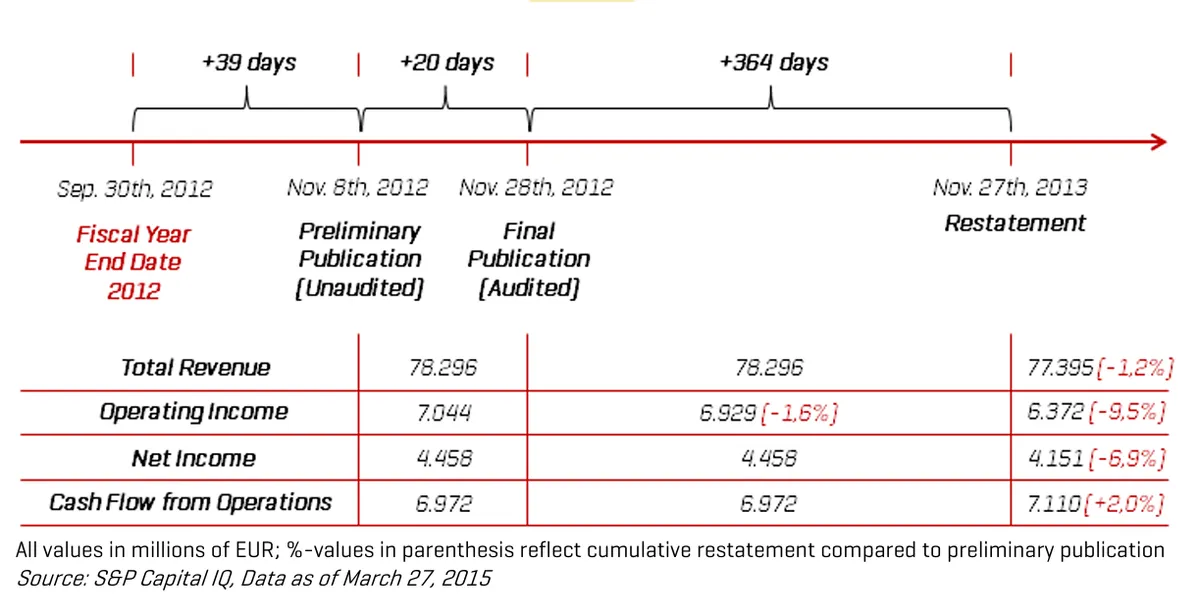
S&P Global illustrates this with Siemens: preliminary results published in November 2012 were followed by audited figures later that month, then restated figures in November 2013.
Source: S&P Global
So the reporting year stayed the same. Only the available information changed.
To preserve that sequence, keep these distinct dates and identifiers:
- Reporting period or effective date: when the financial activity or company change applies.
- Filing or publication timestamp: when the information became available.
- Provider availability timestamp: when your source made that version accessible.
- Retrieval timestamp: when your pipeline received it.
- Version and source identifiers: which original filing, correction, or restatement supplied the value.
Store corrections and restatements without overwriting previous records.
For example, December accounts filed in March and restated in June can’t inform a February decision. An April decision can use the March version only if your pipeline had received it by then.
Using later information introduces look-ahead bias: your backtest knows something the original decision-maker didn’t.
5. Create Credit-Risk Features
By this point, you’ve sorted entity matching, normalization, and period alignment.
Now, feature engineering can begin.
Start with features that have a clear credit rationale, rather than calculating every ratio the API makes possible.
For a non-financial corporate borrower, useful candidates include:
Feature category | Example calculation | What it helps you assess |
|---|---|---|
Leverage | Interest-bearing debt ÷ total assets | Reliance on debt financing |
Liquidity | Current assets ÷ current liabilities | Short-term financial resources relative to obligations |
Profitability | Operating profit ÷ revenue | Profit generated from sales |
Interest coverage | EBIT (earnings before interest & taxes) ÷ interest expense | Earnings available relative to interest costs |
Growth | Revenue ÷ prior comparable-period revenue − 1 | Expansion or contraction in sales |
Volatility | Standard deviation of quarterly operating margins over a defined window | Variability in operating performance |
Treat these as explicit definitions, not interchangeable labels.
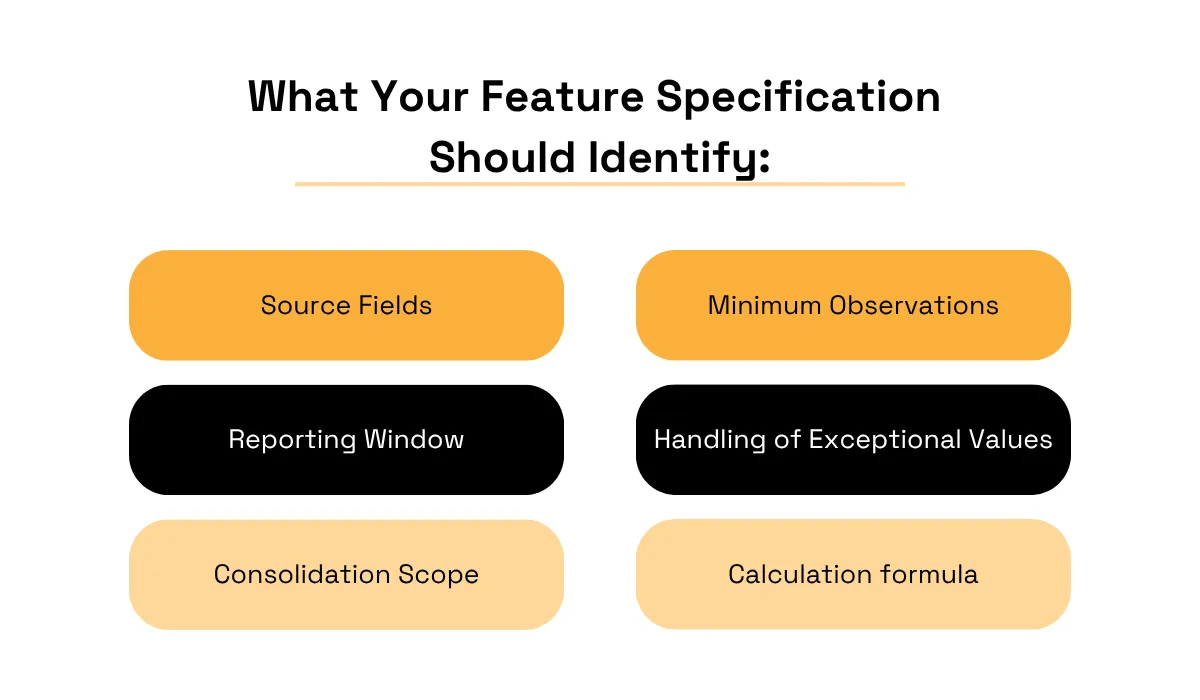
The visual below tells you what your feature specifications should identify:
Source: Veridion
For example, EBIT of €6 million and interest expense of €2 million produce interest coverage of 3×. But if interest expense is missing, you cannot interpret the ratio as zero, or assume the company has no interest burden.
Document how you handle missing inputs, zero denominators, negative values, and stale statements. And keep flags where these conditions carry useful information.
The same goes for transformations.
Learn any rules for filling gaps, rescaling values, or capping outliers from the training data alone. Then apply those same rules to the data used to evaluate the model.
For example, if you fill missing revenue figures with an average, calculate that average from the training data and reuse it for the evaluation data. Repeat this separation for each training split.
This prevents evaluation data from influencing model preparation, as the scikit-learn guidance on leakage points out.
Now, your features are ready. But they need to pass validation before entering the model.
6. Validate the Model Inputs
A completed feature table isn’t automatically a model-ready dataset.
Give validation its own acceptance criteria, recorded results, and release decision. Otherwise, a successful pipeline run can hide a failed data check.
Your gate should cover both individual records and the dataset as a whole:
Missingness | check required fields and null rates by period, sector, and jurisdiction |
|---|---|
Outliers | investigate impossible values and extreme ratios without automatically removing genuine distress |
Temporal stability | compare distributions and reporting gaps across observation dates |
Leakage | verify availability cutoffs and confirm preprocessing learned nothing from held-out data |
Duplicate entities | enforce uniqueness at the intended entity-and-observation-date level |
Source reconciliation | trace sampled features back through conversions to the original financial values |
Coverage changes | identify companies or jurisdictions entering or disappearing from the dataset |
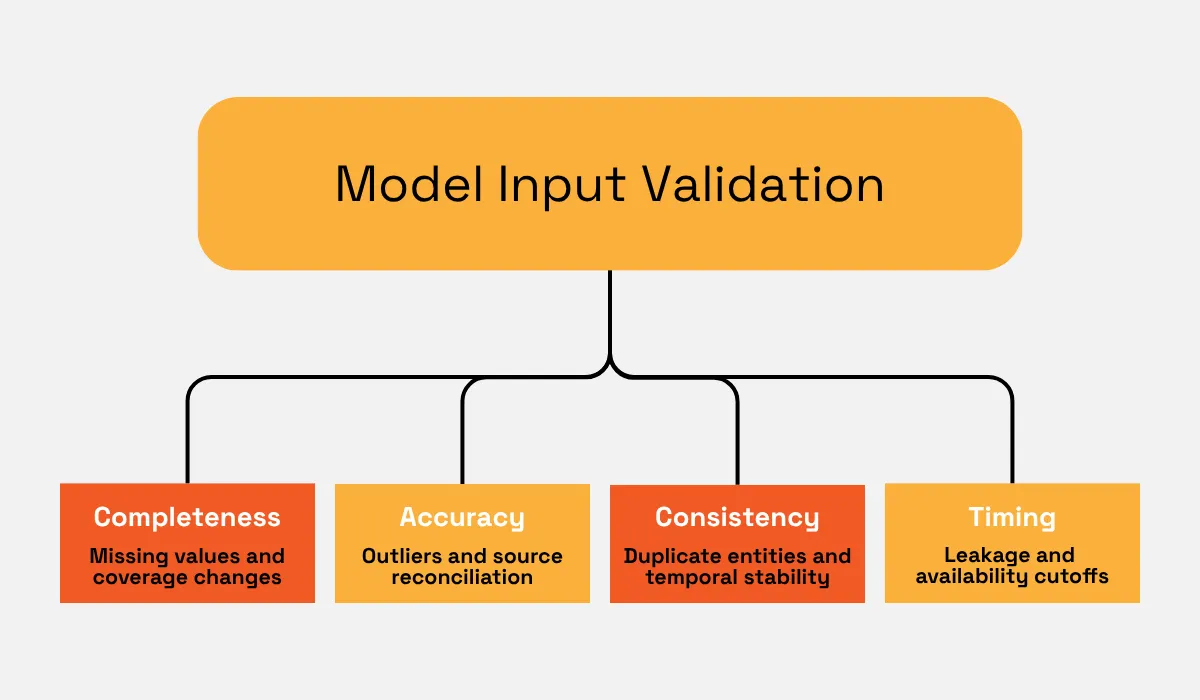
The visual below groups these checks into four areas to review before release:
Source: Veridion
Take a provider that starts returning debt in thousands while your mapping still treats it as whole currency units. The calculation succeeds, but leverage comes out 1,000 times too low.
A distribution check flags the shift. Reconciliation with the source explains it. That’s why you need both.
Define failure rules in advance, like:
- Duplicate feature keys (or inputs unavailable at the decision date) block release.
- Unusual but plausible ratios require review.
Check that historical datasets also show failed or dissolved companies. Losing them can make past credit risk look deceptively low.
In a nutshell: record validation results, hold back affected data, and rerun checks after corrections. Only your approved dataset versions should reach the model.
7. Ingest the Features Into the Model
Once features pass validation, publish them as a versioned dataset that you can reproduce later.
Each row should identify the company and observation date. That’s the point at which you’re assessing its credit risk.
Attach the dataset version, feature-definition version, and validation status so the model consumes an approved release.
Make sure to keep feature definitions stable across development and production. If “leverage” changes from debt-to-assets to debt-to-equity, give it a new definition and assess the model impact before deployment.
Your lineage should let you follow every input backward:
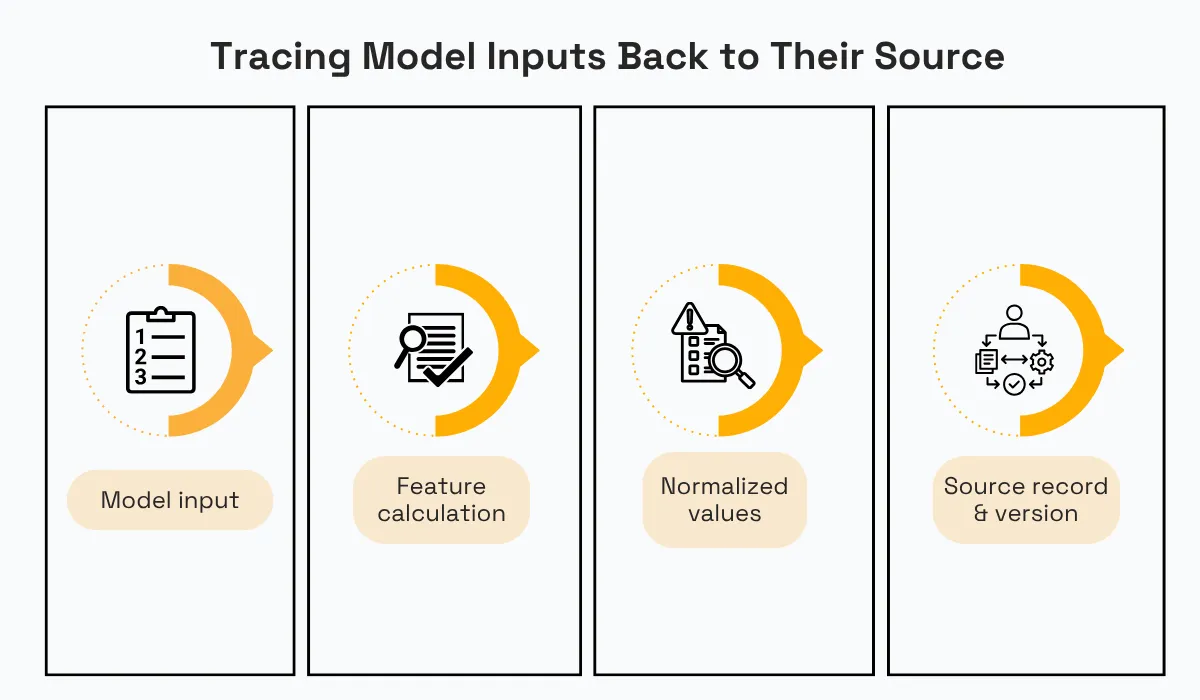
Source: Veridion
Saving preprocessing parameters and dependencies along with the dataset lets you reproduce the same result on every rerun.
Separate data by purpose:
- Training data fits the model and preprocessing parameters.
- Validation data supports model selection and tuning.
- Test data provides a held-out performance assessment.
- Production data supplies new observations for scoring.
Use time-based boundaries appropriate to the forecast horizon, and control entity overlap where your evaluation requires testing on unseen borrowers.
The same approved transformations must operate across these datasets.
So before release, replay a fixed sample through both development and production processing and compare the resulting features. Once they agree, record which dataset and model versions produced each score.
That gives you a trustworthy system for your last step: monitoring the pipeline.
8. Refresh and Monitor the Pipeline
Deployment is far from the final step; it merely marks the start of an ongoing cycle to match and verify incoming data.
This is where you:
- Resolve incoming records against your entity mapping
- Incorporate new reporting periods
- Store revised values as new versions
Recalculate your affected features, then send them through the same validation gate before releasing them for scoring.
Refresh schedules should follow the source and use case.
Operational signals may warrant frequent checks, but financial statements follow filing cycles and can receive corrections between reporting dates.
So always track when the information was reported, as well as when you last retrieved it.
Monitor several layers together:
Monitoring layer | What to watch |
|---|---|
Source delivery | Delayed filings, failed requests, and stale records |
Schema and completeness | Changed field types, missing columns, and rising null rates |
Entity matching | Falling match confidence, unresolved records, and unexpected duplicates |
Feature data | Unusual distributions and shifts across sectors or jurisdictions |
Model performance | Changes in discrimination and calibration as outcomes become available |
Amazon SageMaker Model Monitor is a good example here.
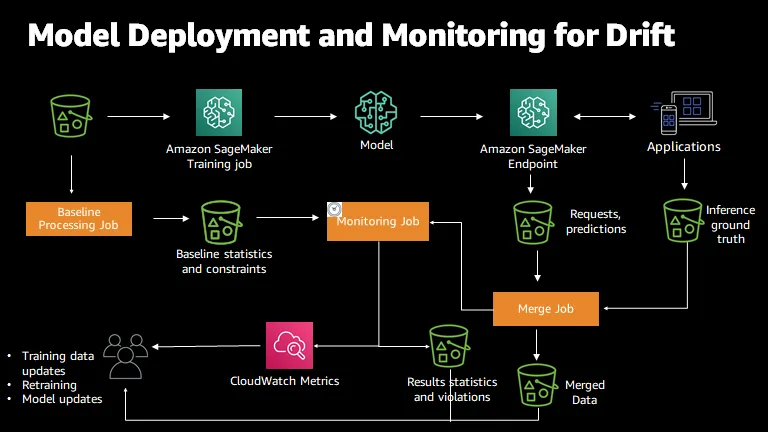
Source: AWS
The service distinguishes data-quality monitoring from model-quality monitoring.
- Data drift means input patterns have changed.
- Deteriorating predictive performance requires outcome-based evidence, which may arrive much later in credit applications.
For example, if your liquidity ratios suddenly become missing for borrowers in one jurisdiction, investigate source coverage and schema changes before treating the shift as borrower deterioration or retraining the model.
Give each alert an owner and a defined response, like quarantining affected records or pausing a release.
Conclusion
Now you know the steps to build a financial data pipeline your credit model can rely on.
The real value is being able to explain why a certain input belongs in your decision. And then, to spot if it doesn’t belong there anymore. That helps data teams and credit analysts investigate unexpected results together and make smart, informed decisions.
So start with a small borrower sample, then test each stage. And when the inputs pass your checks, scale up. You’ll have a clearer path from source data to credit decisions you can explain.
Articles
Discuss how these trends affect your organization.
Our analysts are available for a short call. Bring a specific question and we will ground it in the data.
Insights
Keep reading
More analysis, research, and outcomes grounded in live company intelligence.
What Are the Benefits of Data Enrichment?
Want to understand the benefits of data enrichment? This guide will explain how enriched data supports better decisions and analytics.
Why Market Intelligence Matters in Healthcare More Than Ever
Is healthcare market intelligence more critical now than ever? Understand the evolving landscape and gain a competitive edge with essential insights.
9 Essential Sources of Market Intelligence
Want to boost your market knowledge? These 9 market intelligence sources will show you where to look and how to apply the insights.