Insights / Articles
How To Estimate Private Company Revenue Without False Precision
Decimal places do not make a figure accurate. Use five operating proxies to estimate private company revenue, then report a range your team can defend.

- A filed account may tell you less about revenue than you expect.
- Independent proxies can reveal assumptions that a single estimate hides.
- Veridion provides headcount, location, and business activity data with sources and confidence scores, and labels revenue as official or estimated.
A revenue estimate with several decimal places can look convincing, even when it isn’t accurate.
To better estimate private company revenue, compare disclosures with evidence like headcount, locations, and customer pricing. Then, present a rounded range with a confidence level.
How to Estimate Private Company Revenue Step by Step
Start by checking if the company disclosed its revenue anywhere. If it hasn’t, build separate estimates from different kinds of operating evidence, then compare them to get a plausible range.
Keeping those estimates separate also makes disagreements visible, so you can investigate weak assumptions before combining the results.
1. Look for Reported Revenue First
Before estimating revenue, look for a figure the company has already disclosed.
Look for one that shows which company it covers, what period it refers to, and which currency it uses. If it comes from financial statements, check whether they were audited.
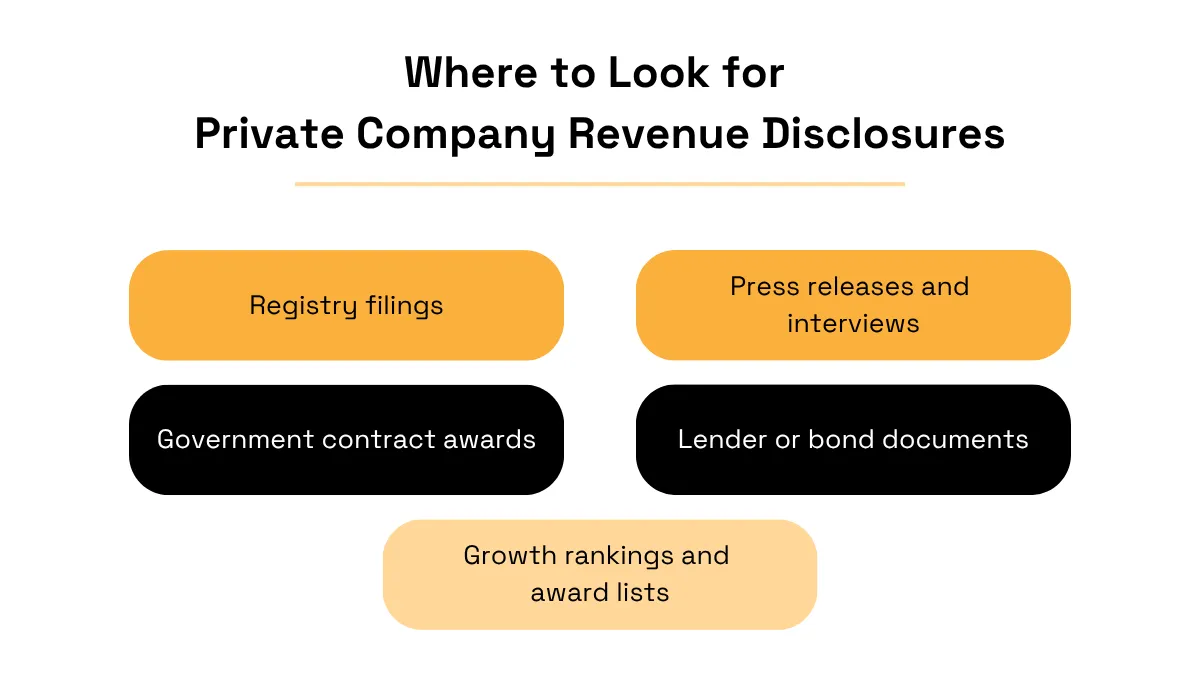
Check these sources:
Source: Veridion
Each of these sources has limitations worth noting:
Source | Limitation |
|---|---|
Registry filings | Revenue disclosure requirements vary, and filed accounts aren’t necessarily audited. |
Government contract awards | Awards may span several years, include options that never get exercised, or show a maximum contract value rather than earned revenue. |
Growth rankings and award lists | Figures may be self-reported, so check how the organizer verifies them and which year they cover. |
Press releases and interviews | Management may quote forecasts, bookings, or annualized run rates rather than actual annual revenue. |
Lender or bond documents | Documents may not be publicly accessible, and financial disclosures aren’t always independently audited. |
A registry search can still leave you empty-handed.
In the UK, for example, eligible small companies can omit their profit and loss account from Companies House filings. And micro-entities can file a simplified balance sheet with the required notes, without disclosing revenue.
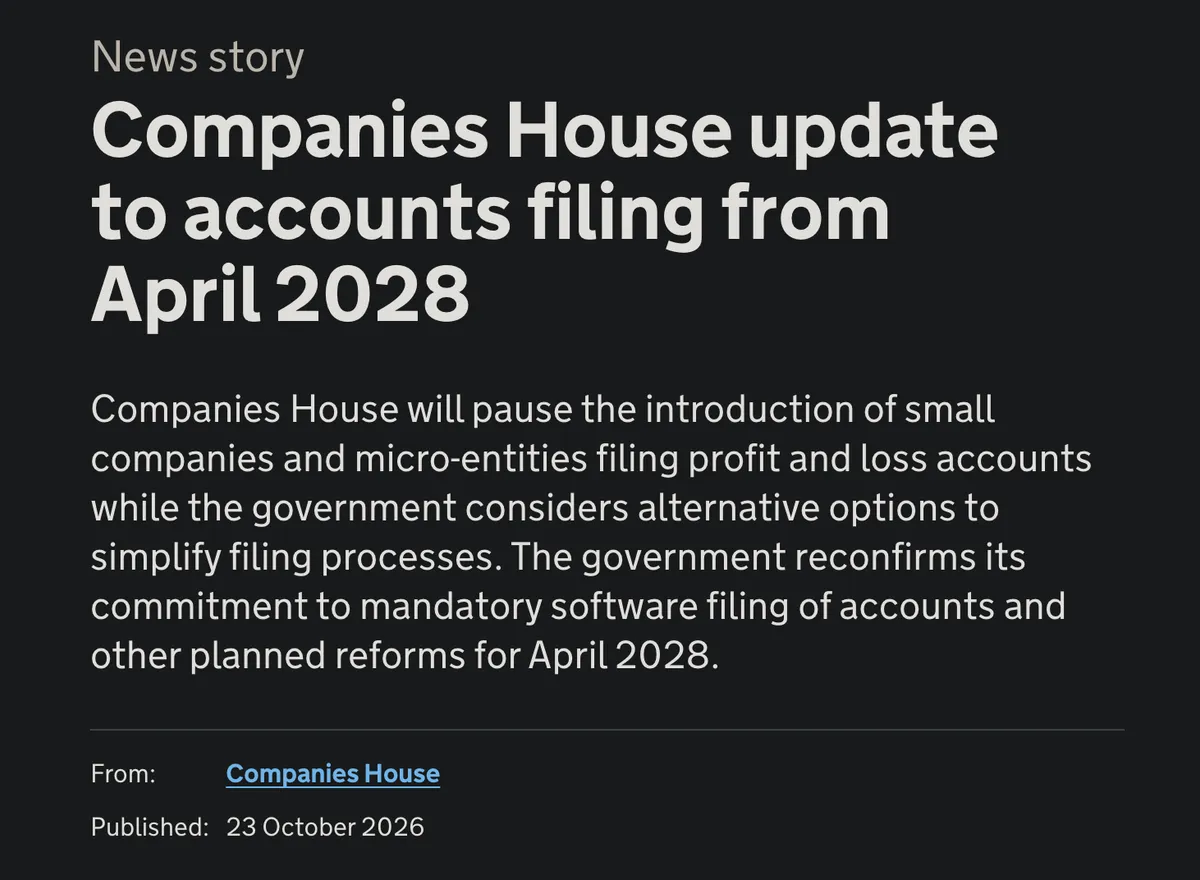
On October 23, 2026, the UK government paused the planned April 2028 requirement for small companies and micro-entities to file profit and loss accounts, and confirmed that smaller companies can still leave them out of the accounts they file after April 1, 2028.
Source: Companies House
Mandatory software filing still starts in April 2028, but it changes how companies file accounts, not what small companies have to disclose.
Apply the same scrutiny to company databases.
Check the revenue-type label and underlying source: a figure extracted from published accounts is reported revenue. But a figure inferred from operating signals is modelled.
And keep that distinction in a dedicated field next to your value, along with its period and source. Without that label, someone could easily mistake an estimate for revenue the company actually reported.
Finally, check if the figure covers the operating company, one subsidiary, or the consolidated group before using it.
If no suitable disclosure exists, move on to operating proxies.
2. Build Separate Estimates From Operating Proxies
When disclosures fall short, estimate revenue from operating proxies. These are the resources a company uses and the customers it serves.
Calculate each proxy separately, so you can see which assumptions drive the result.
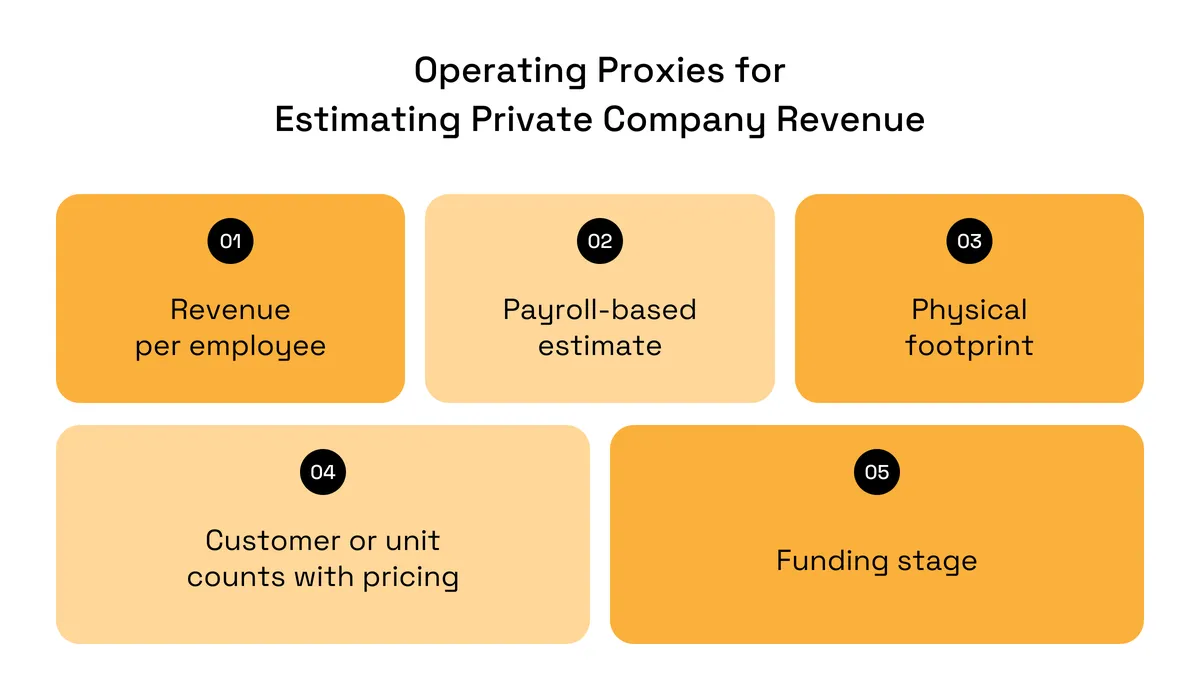
These are the main proxies you should look at:
Source: Veridion
Estimate revenue by multiplying headcount by a revenue-per-employee range from similar businesses.
The Census SUSB tables let you calculate industry averages from receipts and employment. However, receipts appear only in years ending in 2 or 7. The 2022 tables were published in 2025; check their relevance against recent peer disclosures.
For a payroll-based check on US targets, multiply headcount by county or state industry wages from BLS QCEW.
Then, divide by the highest plausible payroll-to-revenue share for the industry. QCEW data come out about five months after each quarter ends. Treat this as a conditional floor: investor-funded businesses can spend more on payroll than they earn.
Now, use the remaining proxies where the business model supports them:
Proxy | Inputs you need | Where to find them | Works best for | Main source of error |
|---|---|---|---|---|
Revenue per employee | Headcount; comparable revenue-per-employee band | Company disclosures, SUSB, comparable accounts | Businesses with similar labor models | Wrong peer group or incomplete headcount |
Payroll-based floor | Headcount; annual wages; payroll share of revenue | BLS QCEW, accounts, industry benchmarks | Established labor-intensive businesses | Funding losses; missing benefits or contractors |
Physical footprint | Active sites, floor area or capacity; utilization; sales benchmark | Location data, property records, permits, company websites | Retail, manufacturing, hospitality | Treating unused capacity as actual output |
Customers or units × pricing | Paying customers or units sold; realized annual price | Disclosures, pricing pages, procurement records | Businesses with identifiable volumes and pricing | Free users, discounts, churn, or list prices |
Funding stage | Round date and stage; revenue disclosures from matched peers | Funding announcements, investor portfolios, peer disclosures | Investor-backed companies with comparable business models | Assuming a funding round implies a revenue threshold |
Choose proxies that reflect how the target actually earns revenue, rather than forcing every company through all five.
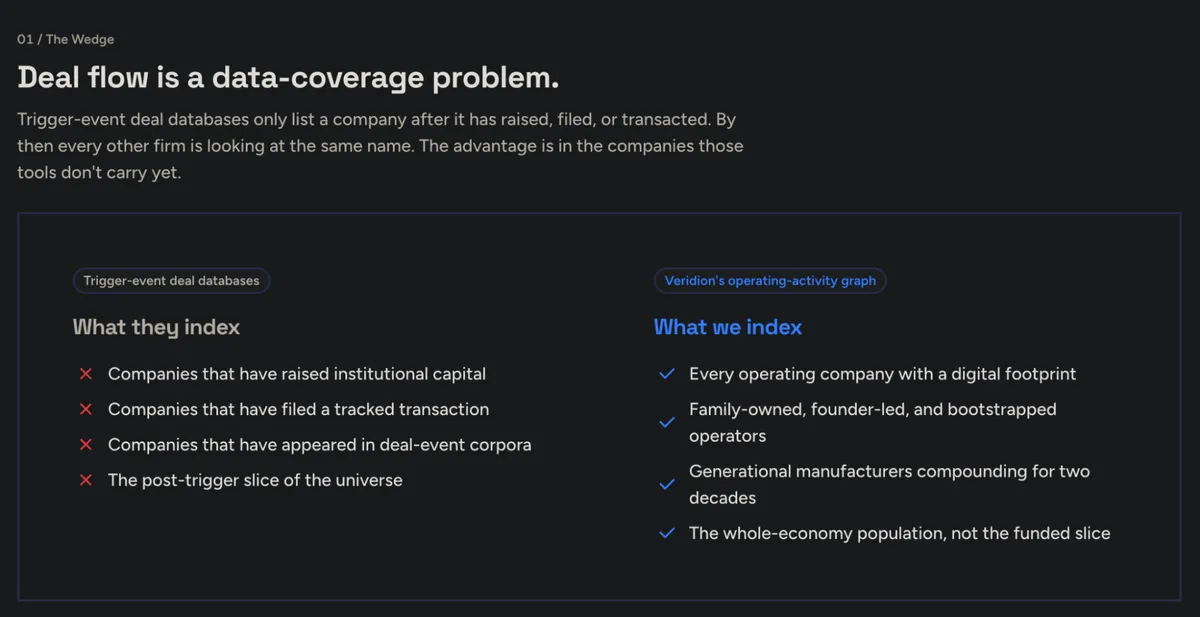
Veridion’s private equity data can help you here.
Our platform provides employee counts, business activity details, and operating locations by facility type.
That includes founder-led and bootstrapped businesses that haven’t raised funding or appeared in a tracked deal.
Source: Veridion
For each attribute, you can check:
- The source
- When it was last verified
- Its confidence score
With these in mind, you can decide how much weight to give it in your estimate.
Check the Employee Count Type: “Extracted” means published in a source Veridion uses. “Modelled” means generated by our algorithms.
Our revenue attribute works in a similar way. It distinguishes official published values from estimated values for companies that don’t disclose revenue.
Compare Veridion’s modelled revenue with your other estimates, and keep it labeled as estimated. If they rely on the same inputs, similar results don’t necessarily give you extra confirmation.
3. Combine the Estimates Into a Revenue Range
Before comparing estimates, make sure they cover the same period, currency, and company or group.
Here’s what it means when they agree closely or are far apart:
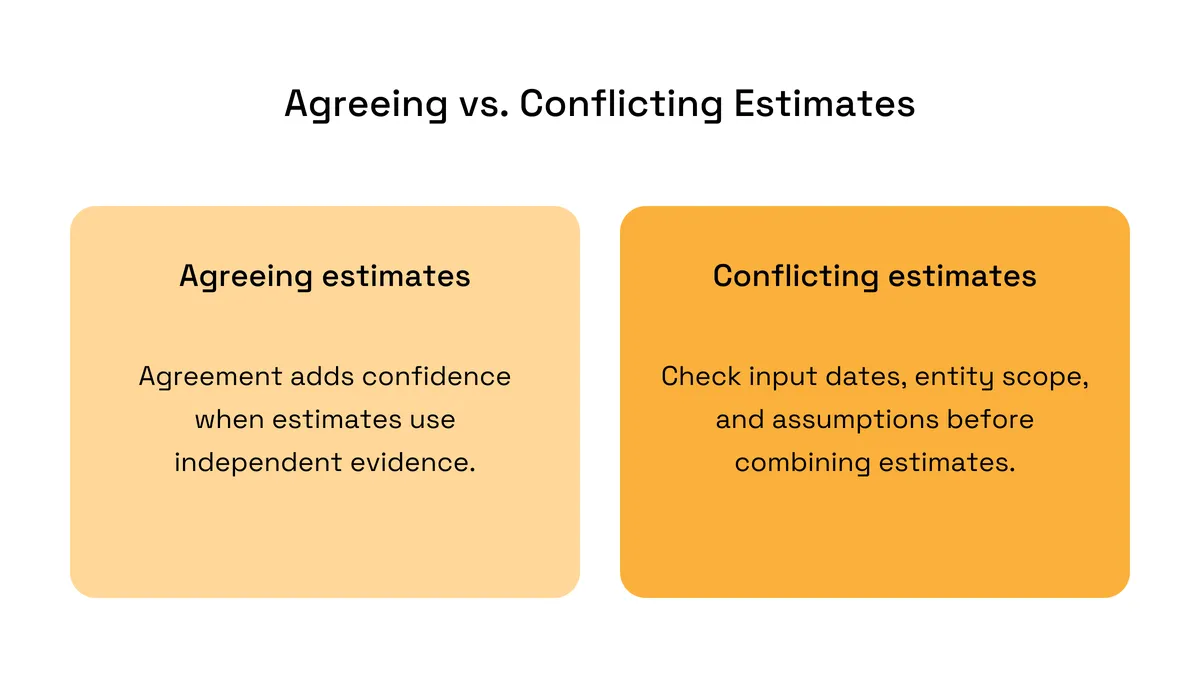
Source: Veridion
Give more weight to current, traceable inputs that match the target’s business model.
For example, a recently extracted headcount that shows the correct entity may deserve more weight than a modelled count. But even “extracted” doesn’t always mean accurate.
Next, set three scenarios:
- Low case: Use conservative, credible assumptions about volume, pricing, or productivity.
- Base case: Use the best-supported assumptions, retaining a central range.
- High case: Use stronger but still plausible assumptions, allowing for capacity limits.
Say a hypothetical services company’s headcount supports $8–12 million, moderate confidence, but independently documented customer volumes and pricing support $9–13 million, moderate confidence. You can thus record a low case of $8–9 million, a base case of $9–11 million, and a high case of $11–13 million, each with moderate confidence.
Present the overall result as “Estimated annual revenue: approx. $8–13 million; moderate confidence.” The narrower base case helps explain your assumptions without turning any single number into the answer.
Assign confidence using the same evidence standard every time.
Here’s what that can look like:
Confidence level | Evidence it requires | How to present the figure |
|---|---|---|
High | Current, traceable inputs; multiple independent methods agree; entity scope is clear | Rounded range, labeled estimated, with period and supporting evidence |
Moderate | Credible inputs and broadly consistent methods, but some assumptions remain unverified | Wider rounded range, with the main uncertainty stated |
Low | Sparse or dated inputs, weak benchmarks, or unresolved disagreement | Broad indicative range with explicit caveats; mark unknown if no bounds are defensible |
These labels describe your assessment of the evidence, not statistical confidence intervals.
Widen the range when plausible changes to headcount, utilization, or pricing materially change the result. Narrow it only when stronger evidence resolves those uncertainties.
Round your estimate to match the detail in your inputs. If you only know revenue is likely somewhere between $8 million and $13 million, adding decimal places would make it look more accurate than it is.
How to Check a Private Company Revenue Estimate Before You Use It
Before adding your range to a screen, CRM, or investment committee memo, make sure it makes operational sense.
Run the checks below against both ends of the range:
Check | What it catches | What to do if it fails |
|---|---|---|
Implied revenue per employee | Revenue inconsistent with the workforce or industry | Recheck headcount, entity scope, and peer selection |
Payroll floor | Revenue unlikely to support the estimated wage bill | Revisit wages and payroll assumptions; check whether external funding supports losses |
Similar-sized comparable companies | Benchmarks distorted by much larger businesses or different operating models | Select closer peers by activity, geography, scale, and outsourcing model |
Industry expert or former employee calls | Unrealistic assumptions about pricing, utilization, staffing, or customer volumes | Revise the affected assumptions and document conflicting views |
A failed check should trigger an investigation, not an automatic adjustment toward the industry average.
Veridion’s methodology includes a similar check before delivery.
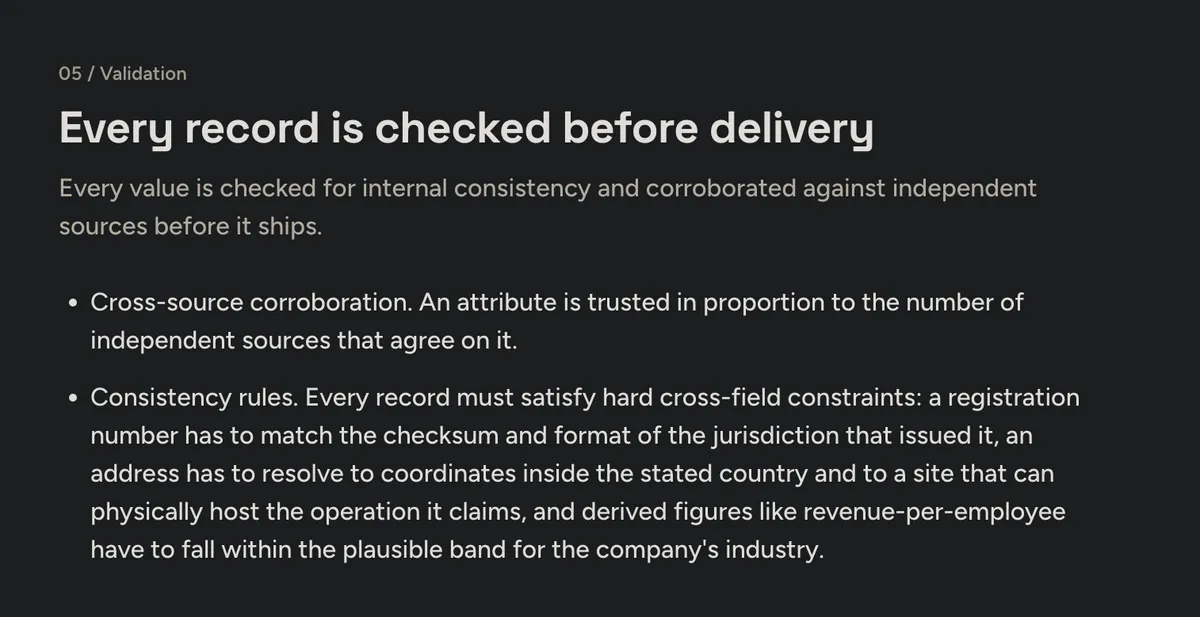
Source: Veridion
Our consistency rules require derived revenue-per-employee figures to fall within a plausible industry band. That helps catch internal contradictions.
It doesn’t turn modelled revenue into reported revenue, though.
For expert calls, ask about the assumptions behind the estimate: typical staffing per site, realized prices, production utilization, etc. Record the speaker’s relevant experience and its date, and treat their observations as corroboration rather than financial verification.
Keep enough detail for a colleague to reproduce your calculation:
- Company identifier, entity scope, currency, and revenue period
- Input values, source links, source dates, and collection dates
- Benchmark segments and years, formulas, and assumptions
- Separate proxy ranges, final scenarios, confidence level, and rationale
Some changes should trigger a re-estimate, as shown below:
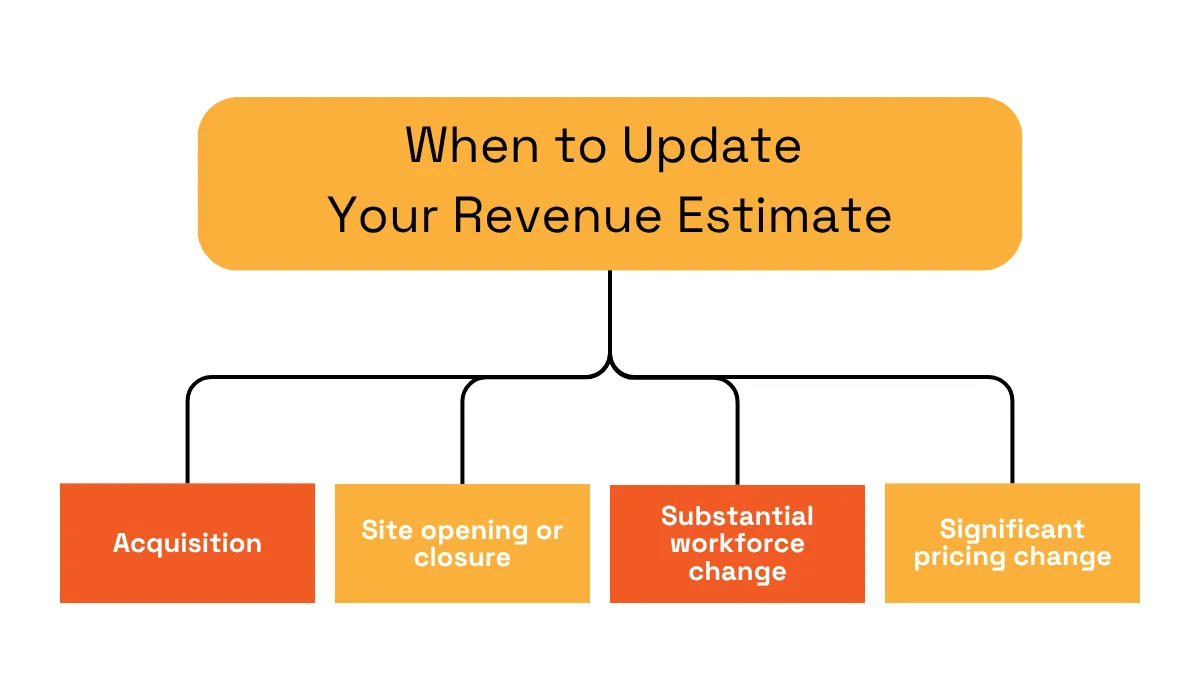
Source: Veridion
Also review estimates before reuse if their underlying evidence has aged beyond your team’s refresh policy.
Give the low and high revenue estimates their own fields in your CRM. And add the confidence level, period covered, and date you made the estimate.
Finally, make sure you label the revenue as reported or estimated. And always keep those labels when you export the data so your colleagues can also tell which is which.
When Revenue Proxies Break Down
Operating proxies work only when the inputs describe how the target earns revenue.
Unusual entity structures, accounting policies, or labor models can break that relationship, even when the underlying data is accurate.
Here are six such cases and what to use instead:
Company type | Which proxy fails | What to use instead |
|---|---|---|
Holding companies and SPVs | Headcount and footprint may say little about entity-level income | Entity accounts and ownership mapping; estimate operating subsidiaries separately |
Distributors, staffing agencies, and travel agencies | Revenue per employee becomes misleading when gross and net reporting differ | Peers using the same accounting basis; transaction volumes and retained fees where appropriate |
Contractor-heavy or outsourced businesses | Employee counts understate the labor supporting sales | Contractor-adjusted labor inputs, customer volumes, or production evidence |
Seasonal or project-based businesses | A current staffing or activity snapshot misrepresents the year | Full-year staffing patterns, completed projects, and delivery schedules |
Groups with employees and revenue in different entities | Headcount and revenue cover different organizational boundaries | Matched consolidated data or entity-level accounts |
Companies in sparse-data regions | Missing inputs and unsuitable foreign benchmarks undermine several proxies | Local filings, local peers, and direct company evidence |
Adjust the method to the business before deciding how much confidence the result deserves.
Check if pass-through revenue includes the full customer payment or only the retained fee, and use benchmarks on the same basis. Widen the range when contractor numbers are unclear or seasonal, and project data cover only part of the year.
For groups, match headcount and revenue to the same entities before estimating. For holding companies and SPVs, use entity accounts; if they’re unavailable, mark revenue as unknown.
Lower confidence when local evidence is sparse. And if you can’t establish the accounting basis, entity scope, or plausible bounds, mark revenue as “unknown.”
What a Revenue Estimate Can't Tell You
A revenue range describes possible sales scale. It doesn’t establish profitability, recurring revenue quality, customer concentration, or growth. Even your most credible current estimate can’t show direction without comparable historical evidence.
This is where operating signals can help. These signals identify which companies deserve closer attention when financials are unavailable.
Look for changes over time in:
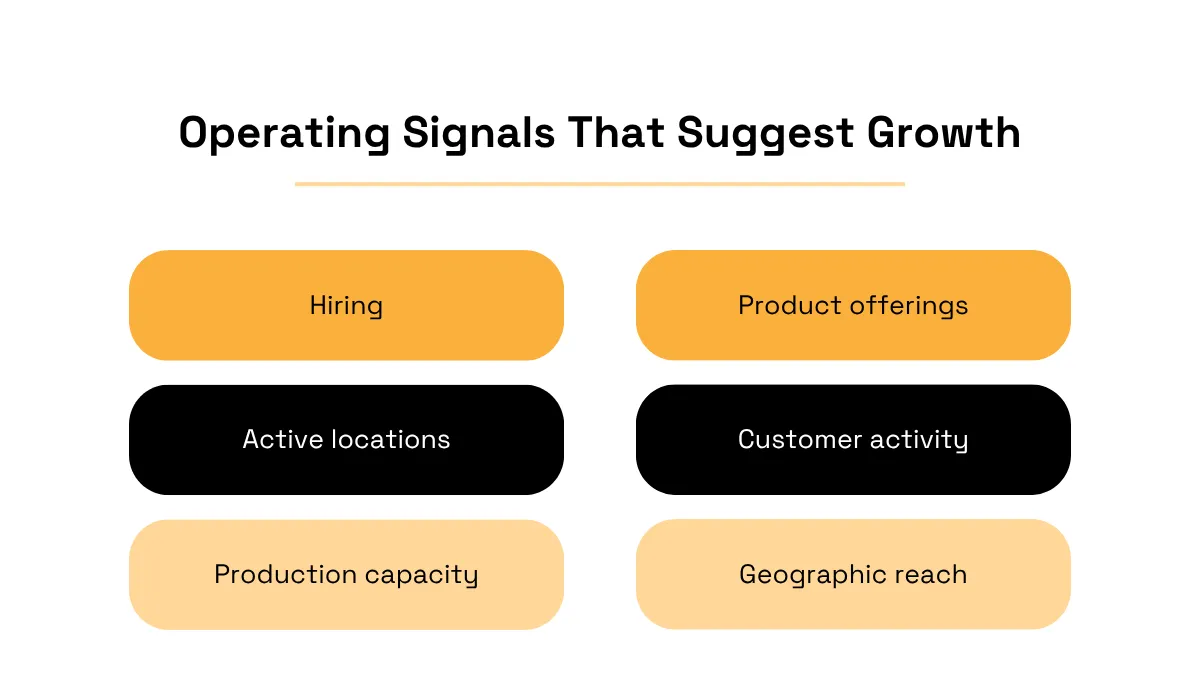
Source: Veridion
A Veridion customer story shows how this works in practice.
A US financial-data provider wanted to identify companies gaining momentum. That included private businesses missing from its existing coverage.
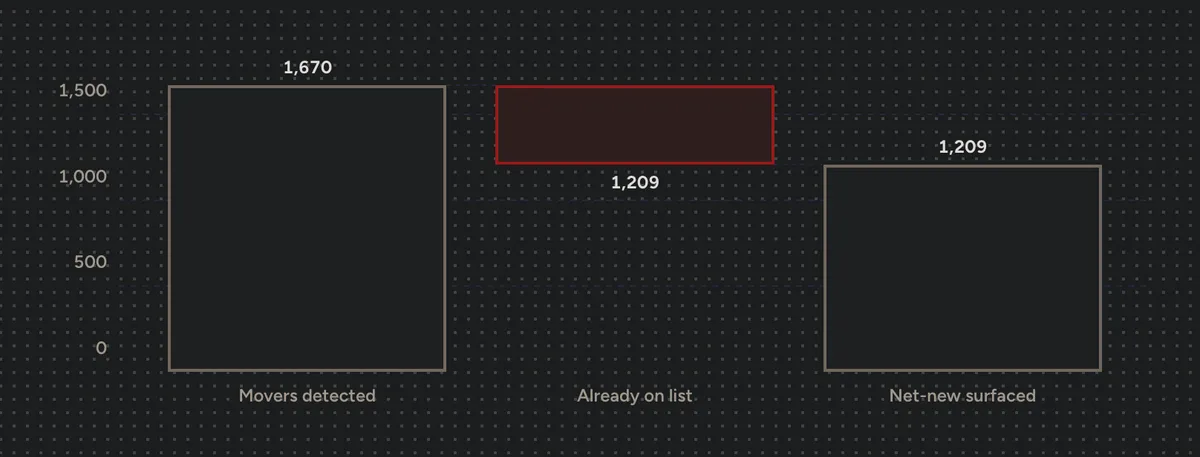
Veridion compared successive observations of job postings, locations, buildings, and reviews to produce four signal families: hiring momentum, geographic expansion, headquarters upgrades, and reputation trends.
Source: Veridion
Hiring signals tracked changes in open roles, and location signals captured new sites and changes in footprint.
Headquarters analysis compared old and new premises, including building size and class. The four signals rolled into a single investability score, so the provider could rank companies by momentum. In the relocation analysis alone, Veridion found 1,670 companies with headquarters or footprint moves, and 1,209 of them (72%) weren’t on the provider’s existing list.
These are prompts to investigate possible expansion, not revenue estimates or proof of sales growth. A larger headquarters or hiring surge may precede additional revenue, but it can also reflect spending ahead of demand.
Once management accounts arrive, reconcile actual revenue to the same period and entity scope as your estimate.
Check the following:
- Recognition policies
- Gross versus net presentation
- Monthly trends
- Recurring versus one-off sales
- Customer concentration
- Margins
- Cash collection
Then extend commercial due diligence to customer demand, retention, and competitive position.
For founder-owned businesses, examine dependence on the founder’s relationships and informal reporting processes.
If you combine company-level revenue ranges to estimate a market’s size, follow the bottom-up market sizing approach to define the relevant population and avoid counting group entities twice.
Conclusion
A defensible private company revenue estimate is a rounded range supported by traceable inputs, explicit assumptions, and a confidence level. It gives your deal team a usable screening tool while keeping uncertainty visible.
Start with your current target list: flag every unlabeled revenue figure, then record whether it is reported, estimated, or unknown before using it in the next screen.
Articles
Discuss how these trends affect your organization.
Our analysts are available for a short call. Bring a specific question and we will ground it in the data.
Insights
Keep reading
More analysis, research, and outcomes grounded in live company intelligence.
Sizing the Opportunity: How Bottom-Up Company Data Sharpens TAM and Market Sizing
Struggling with inaccurate market sizing? Learn how bottom-up company data reveals crucial market signals for strategic planning.
5 Types of Market Intelligence You Need to Know About
Explore five different types of market intelligence that can shape your competitive edge. Find out which ones your team should prioritize.
How to Gather Market Intelligence In 5 Steps
In this guide, we're breaking down the five key steps you need to take to gather market intelligence that drives real action.