Insights / Articles
5 External Data Signals That Strengthen Private-Credit Underwriting
Struggling with private credit underwriting? Uncover 5 external data signals that can significantly improve your risk assessment.

- Public-market credit data and workflows cannot be applied unchanged to private borrowers.
- Verified entity and ownership data can reveal who you're actually underwriting.
- Operational and growth signals can provide evidence beyond reported financials.
- Industry and location data can expose risks and concentrations hidden in records.
Imagine underwriting a borrower without a 10-K or another comprehensive, standardized public disclosure package.
There may be no earnings calls or analyst coverage, while audited financial information may be less frequent, less standardized, or available only through the borrower’s diligence materials.
Private-credit lenders underwrite businesses that often lack the public disclosure infrastructure available to listed companies.
That means the data infrastructure built for public-market credit analysis doesn’t transfer cleanly.
A public-issuer workflow can provide a starting point, but it must be adapted and supplemented to address private-company data gaps.
That’s why you also need five categories of outside-in signals, i.e., the data collected independently of the borrower from public records, websites, operational footprints, and third-party datasets.
In this article, we break down these signals.
Verified Company Identity and Structure
This first signal is all about authenticating a borrower's legal existence, ownership hierarchy, and key controllers.
In other words, before any financial or operational signal can inform a lending decision, you need to know which legal entity you’re actually assessing and lending to.
A borrower's legal name, trading brand, website, and registered company may not refer to the same entity.
The reconciliation challenge can be greater for privately held businesses because ownership information may be fragmented across jurisdictions and legal structures.
A 2023 study using a global dataset found that 54% of subsidiaries are controlled through indirect ownership, with ownership chains spanning as many as seven countries.
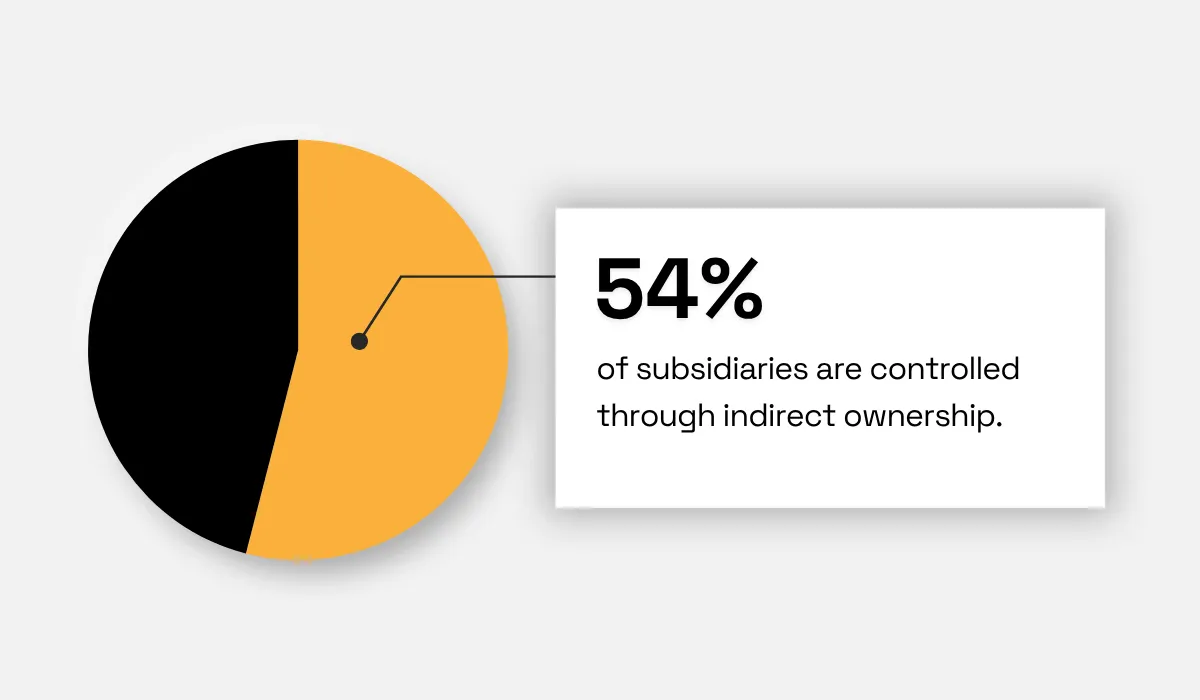
For lenders, that means identifying only a borrower's immediate parent may not reveal the full ownership structure or other connected entities.
A name match, or even a valid registration-number match used without group-level reconciliation, may identify the legal entity without revealing its complete operating and ownership context.
For a private credit data workflow, entity resolution should establish at least three things:
Legal entity | Confirms you're assessing the correct borrower. |
|---|---|
Ownership structure | Reveals parent companies, subsidiaries, and affiliates. |
Operating identity | Connects brands, websites, locations, and activities to the right entity. |
Public filings, like company registries, annual accounts, beneficial-ownership registers where available, securities filings, and similar sources, can provide a strong starting point, but private-company structures often require further reconciliation.
Records can be incomplete across jurisdictions, ownership structures can contain multiple layers, and newly established entities may have limited financial or operational history.
Consider a borrower that trades under a well-known brand while its legal contracting entity is a recently incorporated subsidiary owned by a larger holding company.
If your system resolves the brand to the parent rather than the borrowing subsidiary, you could inadvertently attribute the parent's employees, locations, revenue signals, or operating history to the borrower.
The same problem can occur when a company's corporate structure changes.
Acquisitions, new subsidiaries, name changes, and reorganizations can leave a previously accurate company record disconnected from the entity's current structure or operations.
Identity errors can carry material consequences in lending.
Attaching a business signal to the wrong company may be a simple data-quality issue in a marketing workflow.
But in credit, it can directly affect the risk assessment.
If your system attributes a parent company’s financial strength to a weaker subsidiary, you could overestimate repayment capacity.
If you attribute a subsidiary’s liabilities or deteriorating operations to the wrong entity, you could misjudge the position of a stronger borrower.
And if you fail to establish relationships between the borrower, its parent, and affiliated entities, you may miss guarantees, related-party exposures, or concentration risks that materially affect the credit structure.
Operational Scale Indicators as Financial Proxies
When borrower-provided financial statements are unaudited, infrequent, or subject to a reporting lag, external operational indicators can provide an independent reasonableness check.
Employee count and physical footprint can serve as directional indicators of operational scale, but not as standalone measures of financial performance.
They don't reveal revenue directly, but they can help you test whether reported financials are consistent with the business you can observe.
Headcount provides a rough indication of the economic activity a company can support.
For example, a growing workforce can signal expanding capacity, while the size of the employee base can help you assess whether reported revenue is plausible for the company's industry and business model.
But don't apply a universal revenue-per-employee assumption.
As Brandon Dawson, CEO & Co-Founder of Cardone Ventures, a business consulting and scaling firm, notes:
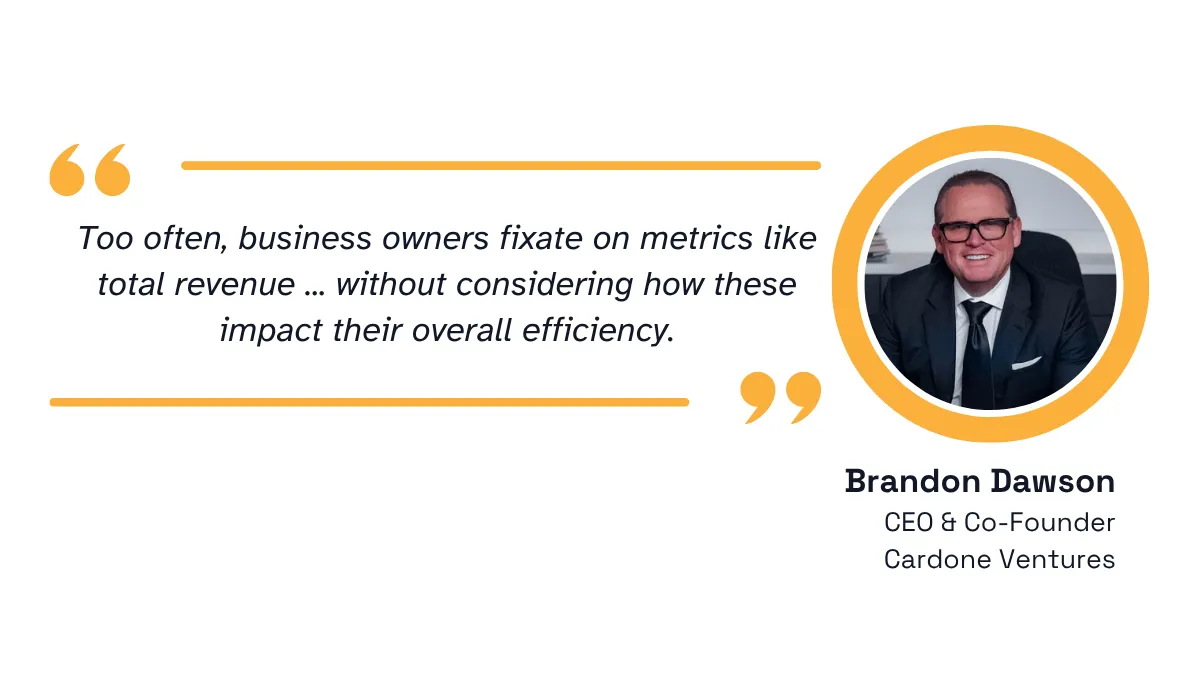
In other words, headcount becomes a more useful indicator when revenue per employee is interpreted against the company’s industry, business model, and labor intensity.
Five hundred employees can support very different revenue levels at a software company, manufacturer, distributor, or professional-services firm.
Headcount becomes more useful when you benchmark it against industry, business activity, growth, and other operating signals.
Facility footprint adds a second view of operating capacity.
The number, type, and geographic distribution of locations can distinguish a company with a substantial operating network from one with little physical activity beyond a registered office.
A manufacturer with several plants, a distributor with multiple warehouses, or a retailer with dozens of stores should leave a very different operational footprint from a professional-services firm with one office.
However, a structured company-data provider can help lenders compare employee, location, activity, and revenue fields across a portfolio.
This is where Veridion adds another layer of evidence.
Its market intelligence data includes employee counts, business locations, activity classifications, and revenue fields that distinguish between extracted and modeled values.
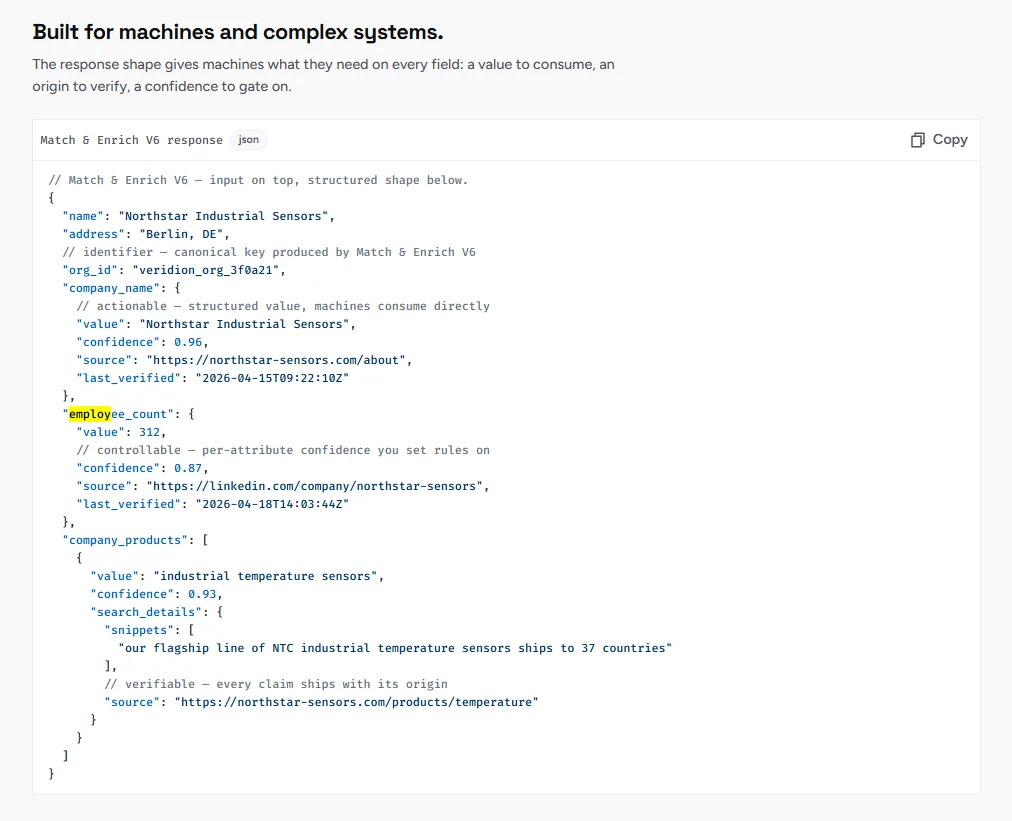
Source: Veridion
Its location data can also distinguish operational sites such as offices, warehouses, factories, and retail locations rather than treating a registered address as the company's entire footprint.
You can combine these signals to build an independent view of operating scale.
If a borrower reports $50 million in revenue, for example, its employee count, facility network, business activities, industry, and other available financial information can help you assess whether that figure matches its observable operations.
But don't treat operational indicators as precise revenue estimates.
No universal margin of error applies to employee count or facility footprint as revenue proxies.
Revenue productivity varies by sector, business model, geography, capital intensity, and growth stage.
Growth Trajectory Signals
The two borrowers may have different operating trajectories, but the implications for credit quality depend on how growth is funded and whether it improves cash generation and debt-service capacity.
One may be hiring, opening new locations, and investing in its digital infrastructure, while the other is holding steady or beginning to contract.
The expanding borrower could have lower current revenue but a different credit trajectory from a larger borrower whose operations are stagnating.
The challenge is that traditional financial metrics, like revenue, EBITDA (Earnings Before Interest, Taxes, Depreciation, and Amortization), and cash flow, are largely backward-looking.
They describe performance during a reporting period, but they may not capture what is changing inside the business today.
Outside-in signals can help narrow that gap by showing changes in operating activity before they appear in the next set of financial results:
Signal | Possible interpretation | Important caveat |
|---|---|---|
Hiring | Capacity expansion or expected demand | Replacement, seasonal or acquisition-related hiring |
New locations | Geographic or operational expansion | Relocation, consolidation or lease commitments |
Technology changes | Operational investment | Routine migration, vendor replacement or remediation |
No individual signal is definitive.
A spike in hiring could reflect seasonal recruitment or replacement hiring, while a new location could simply be a relocation.
The stronger approach is to combine independent signals and look for convergence.
Accelerating hiring alongside new facilities and expansion into additional markets provides stronger evidence of a genuine change in trajectory than any single observation.
A recent customer case study shows how this works in practice.
Source: Veridion
A UK card and payments provider wanted to detect changes in customer activity before they appeared in its transaction data.
It combined four outside-in signals, namely physical locations, employee-count changes, website activity, and technology adoption, into a company-level growth score.
In the 204-company demonstration sample, Veridion reported that 149 companies registered observations across all four components of the score.
The case study does not report subsequent financial or credit outcomes, so it illustrates the method rather than validating its predictive performance.
This becomes particularly valuable when borrower reporting is infrequent.
Financial statements may give you a reliable view of the business at defined reporting dates, but leave a gap between the last reporting period and the company's current state.
Monitoring workforce changes, locations, business activities, and digital investments can provide additional evidence of what is happening during that gap.
Industry and Geographic Risk Context
A private borrower’s risk profile depends heavily on what it does and where it operates.
Two companies with similar revenue, headcount, and leverage can present very different credit risks if one operates in a stable sector while the other depends on a cyclical or disruption-prone industry, or if their operations are concentrated in different regions.
The problem is that the industry and location data available to lenders can be too static to capture those differences.
A company may be registered under a broad industry code that describes its original business but no longer reflects its current operations.
As Alan Ringvald, CEO of Relativity6, an AI-powered commercial underwriting platform, puts it:
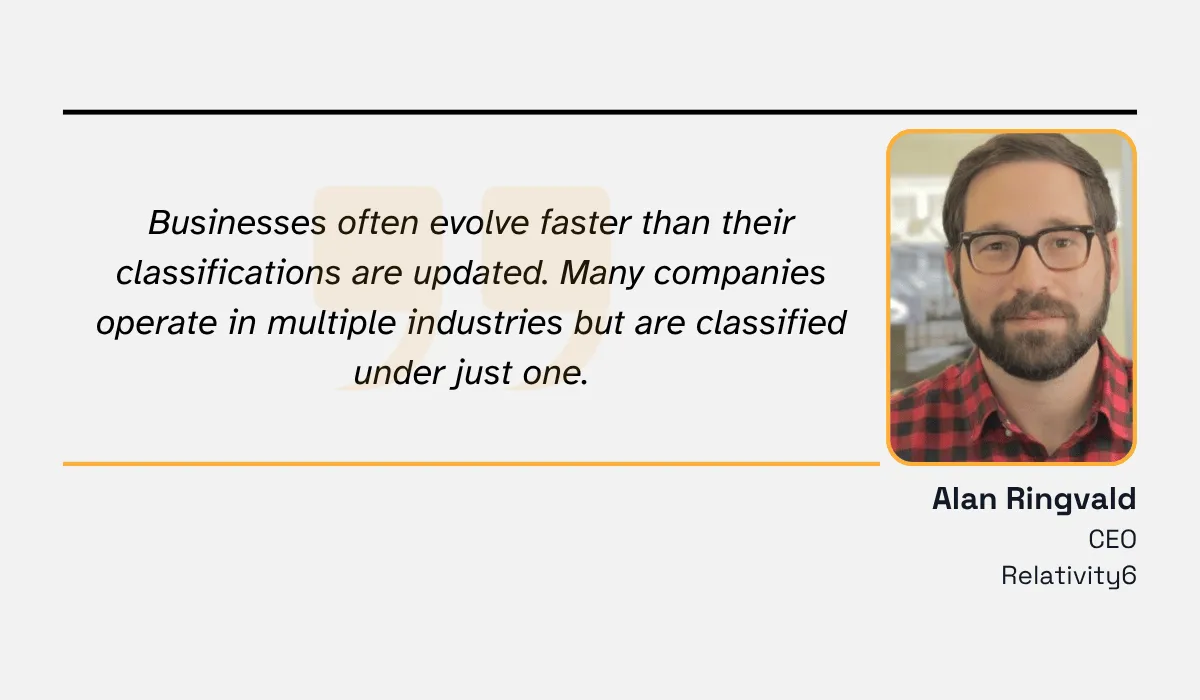
Illustration: Veridion / Quote: AdvantageGo
Don't rely on the primary industry code alone.
A manufacturer may add warehousing and distribution operations, a wholesaler may begin manufacturing its own products, and a retailer may develop a substantial e-commerce operation.
These secondary activities can introduce different regulatory, operational, commodity, or supply-chain exposures.
Verisk documented the consequences of this classification gap in commercial underwriting.
Its analysis found that 52% of commercial policies had Standard Industrial Classification/North American Industrial Classification System (SIC/NAICS) misclassifications, contributing to as much as $6.5 billion in first-year premium leakage.
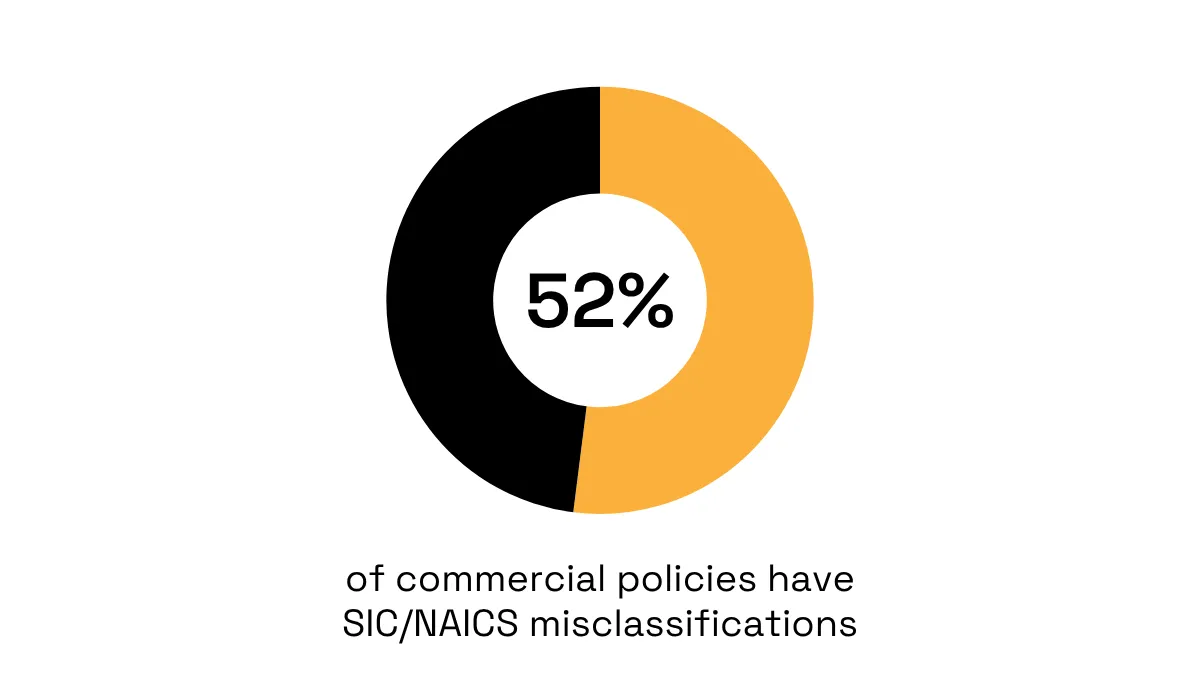
The example comes from insurance rather than credit, but it demonstrates the underlying data problem: a classification that fails to reflect actual operations can conceal material risk.
Industry classification should be validated against observed business activities, rather than treated as a complete description of the borrower.
Geography creates another layer of exposure.
A borrower's registered address tells you little about its actual operating footprint if it also has factories, warehouses, offices, stores, or other facilities across multiple regions.
Those locations can expose the business to different economic, regulatory, environmental, and infrastructure risks.
They can also reveal concentration risk across a portfolio.
Several borrowers may appear unrelated on paper but operate in the same region, depend on the same logistics corridor, or source critical inputs from the same geographic cluster.
A disruption affecting one location, port, transportation network, supplier base, or energy infrastructure could therefore affect multiple borrowers simultaneously.
Location-level data lets you move beyond the registered address and map where borrowers actually operate.
Ownership and Related-Party Exposure
A borrower’s legal entity is only one part of the credit picture.
You also need to understand who owns it, which other companies share that ownership, and which entities provide guarantees or other forms of support.
Private-company structures can make those relationships harder to identify.
A sponsor, family, founder, or investment group may control several companies through separate holding entities, while guarantees and other contractual relationships can connect borrowers with different legal names.
Two companies that appear independent at the borrower level may therefore be economically connected.
This matters when assessing concentration risk.
If multiple portfolio companies share the same parent, sponsor, guarantor, or ownership group, a problem affecting one entity can create correlated exposure across others.
The connection is particularly relevant in private credit, where the IMF estimated that about 70% of private-credit deals were sponsored by private-equity firms.
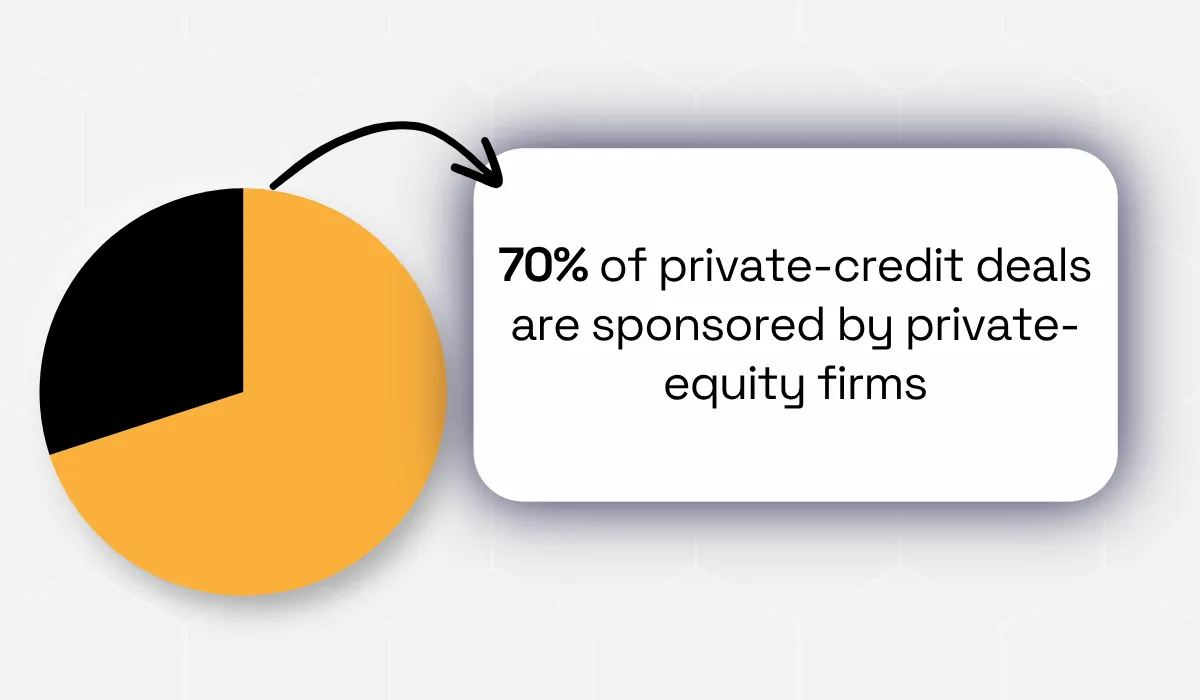
For a portfolio with multiple sponsor-backed borrowers, identifying common ownership can reveal connections that aren’t apparent from individual borrower records.
Sister companies may also share facilities, suppliers, customers, financing arrangements, or cash flows, creating dependencies that aren't visible in individual company records.
Related-party relationships can also change how you interpret financial and operational signals.
For example, weak cash flow could partly reflect significant intercompany payments rather than deteriorating underlying operations.
Similarly, reported growth may be less meaningful if it depends heavily on transactions with a sister company.
A guarantor may strengthen the credit structure, but it can also create another layer of concentration if it supports obligations across multiple borrowers.
The key distinction is between legal independence and economic independence.
Ownership and relationship data help you map the connections between borrowers, parent companies, subsidiaries, sister companies, guarantors, and other related parties.
Model them as a network rather than as isolated borrower records.
Conclusion
The common thread across these five data signals is not that external data should replace borrower-provided financials, but that it can help lenders independently validate and update the picture those financials present.
Entity and ownership data can confirm that information is attached to the correct borrower and reveal relationships that warrant further investigation.
Headcount, locations, business activities, and digital changes can provide additional context on operational scale and direction. Industry and geographic data can help identify exposures that may not be apparent from a registered address or primary industry code.
None of these signals should be interpreted in isolation. A rising headcount does not necessarily indicate sustainable growth, just as a new location does not automatically improve credit quality.
External data may also be incomplete, outdated, modeled, or incorrectly matched.
Its usefulness therefore depends on provenance, observation date, confidence levels, reconciliation with borrower-provided information, and appropriate human review.
Used with those safeguards, outside-in signals can help lenders identify discrepancies, prioritize additional diligence, and monitor changes between borrower reporting dates.
The goal is not to replace conventional credit analysis, but to build a more current and independently validated view of the borrower before funds are deployed, and throughout the life of the loan.
Articles
Discuss how these trends affect your organization.
Our analysts are available for a short call. Bring a specific question and we will ground it in the data.
Insights
Keep reading
More analysis, research, and outcomes grounded in live company intelligence.
Insurance Underwriting Risk Profile for Pharmaceutical R&D Labs
Pharmaceutical R&D labs face unique underwriting challenges. Discover how to build a proper risk profile for insurance purposes.
Using Alternative Firmographics for Faster SMB Credit Risk Assessment
Struggling with slow SMB credit risk assessment? Uncover how alternative firmographics can revolutionize your process and speed up decisions.
6 Types of Concentration Risks Organizations Should Monitor
We will explore six types of concentration risks that impact supply chains, suppliers, and strategic decision-making.