Insights / Articles
How AI Powers Continuous Emerging-Risk Detection
Tired of being blindsided by market shifts? See how AI proactively helps you identify emerging market risks before they impact your business.

- AI-driven risk detection turns scattered signals into decisions in near real time.
- LLMs now extract clean signals from messy filings, fast and accurately.
- Getting a company's "normal" baseline wrong breaks the whole system.
Risk doesn't come with a warning; it is either a missed deadline or a quiet investigation.
And, none of it seems worth worrying about when you run into it individually.
The trouble is that most companies still manage risk the old way with quarterly reviews, static spreadsheets, and teams rarely comparing notes.
That worked when things moved slowly, but not anymore. By the time anyone spots a pattern, the damage is done.
This is where continuous emerging-risk detection helps. It uses five AI capabilities that work together to turn small, scattered signals into clear decisions.
Keeping the System Fed With Up-To-Date Data
The first thing AI changes about risk detection is how much information one system can hold at once.
A person can follow a handful of suppliers across a few news sources.
However, a model can read corporate announcements across millions of companies at the same time, and keep all of them current.
The fact that AI can do all of it at once is what matters the most.
Emerging risk rarely comes in a single headline. It builds as a pattern across sources.
The value stems from watching those sources without a break rather than checking them once a quarter.
Understanding refresh rate is what makes or breaks the system.
The people who run these teams see the shift coming.
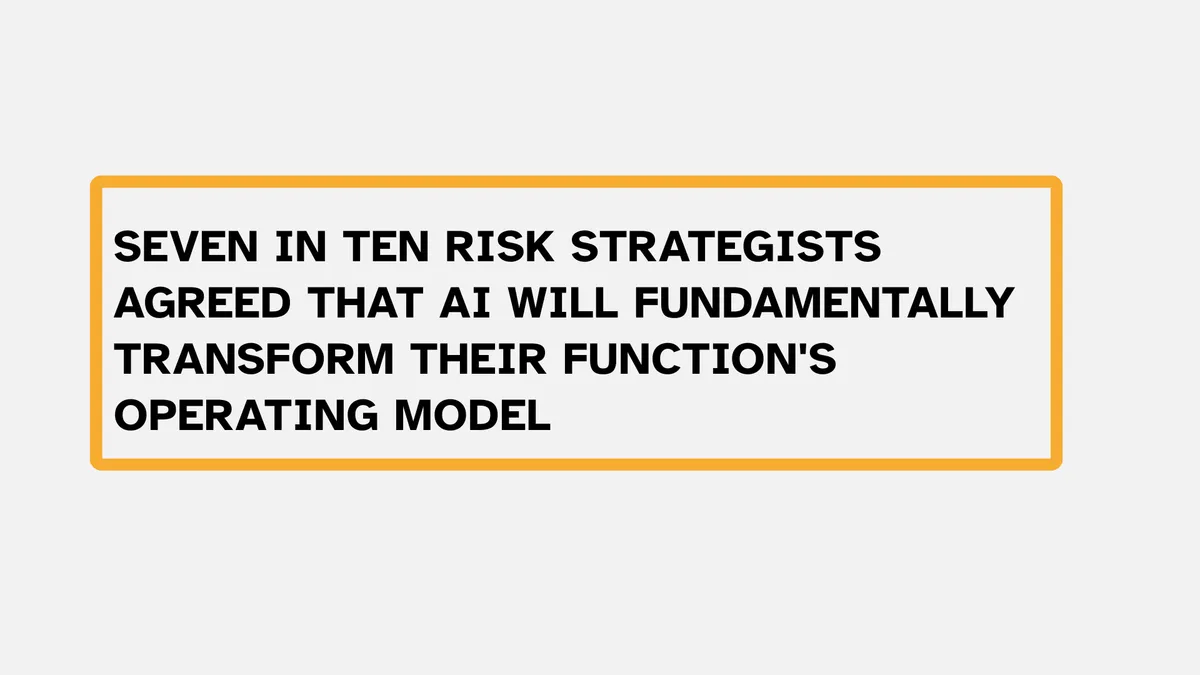
In EY's 2026 Global Risk Transformation Study, seven in ten Risk Strategists said AI will fundamentally change how their risk function operates, against four in ten of their slower-moving peers
What makes that shift urgent is the environment itself.
Bill Diaz, CEO of Archer, a governance, risk, and compliance software company, sums it up perfectly.
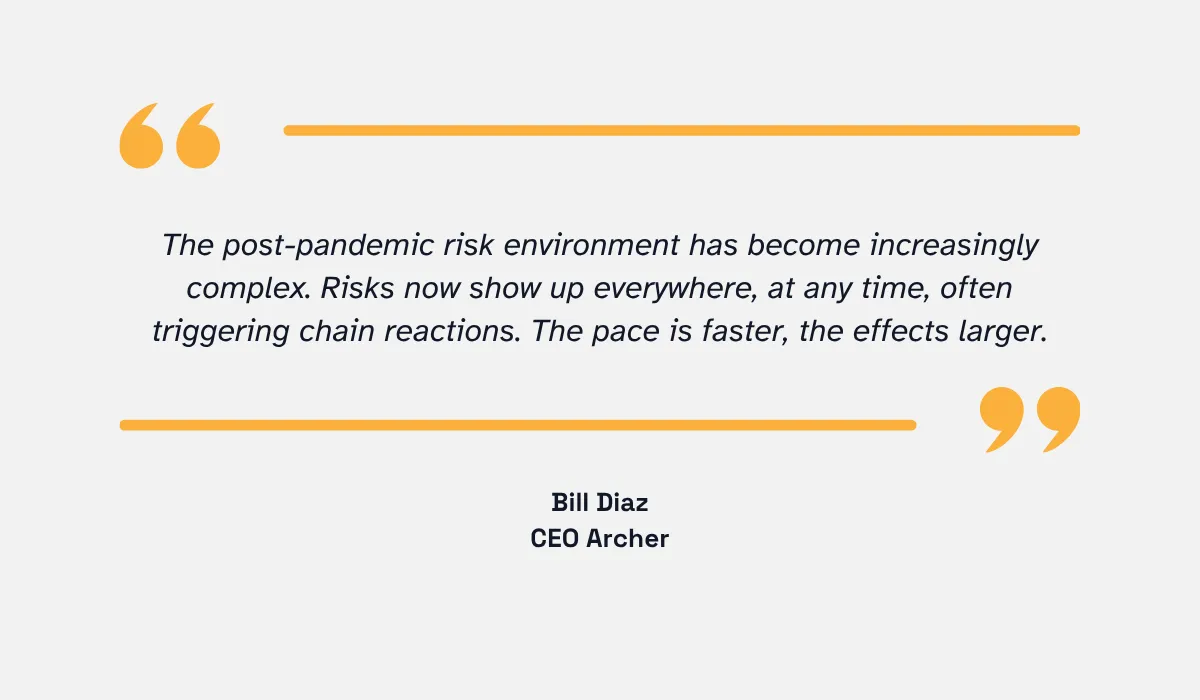
As Diaz puts it, risks now surface anywhere and at any time, often setting off chain reactions.
Due to the sheer pace and scale, AI has to be the one handling them in real time. Doing it across millions of companies is what data-as-a-service platforms are built for.
Veridion is one example.
Instead of refreshing company records every few months, it re-crawls the public footprint of millions of businesses and updates their profiles weekly.
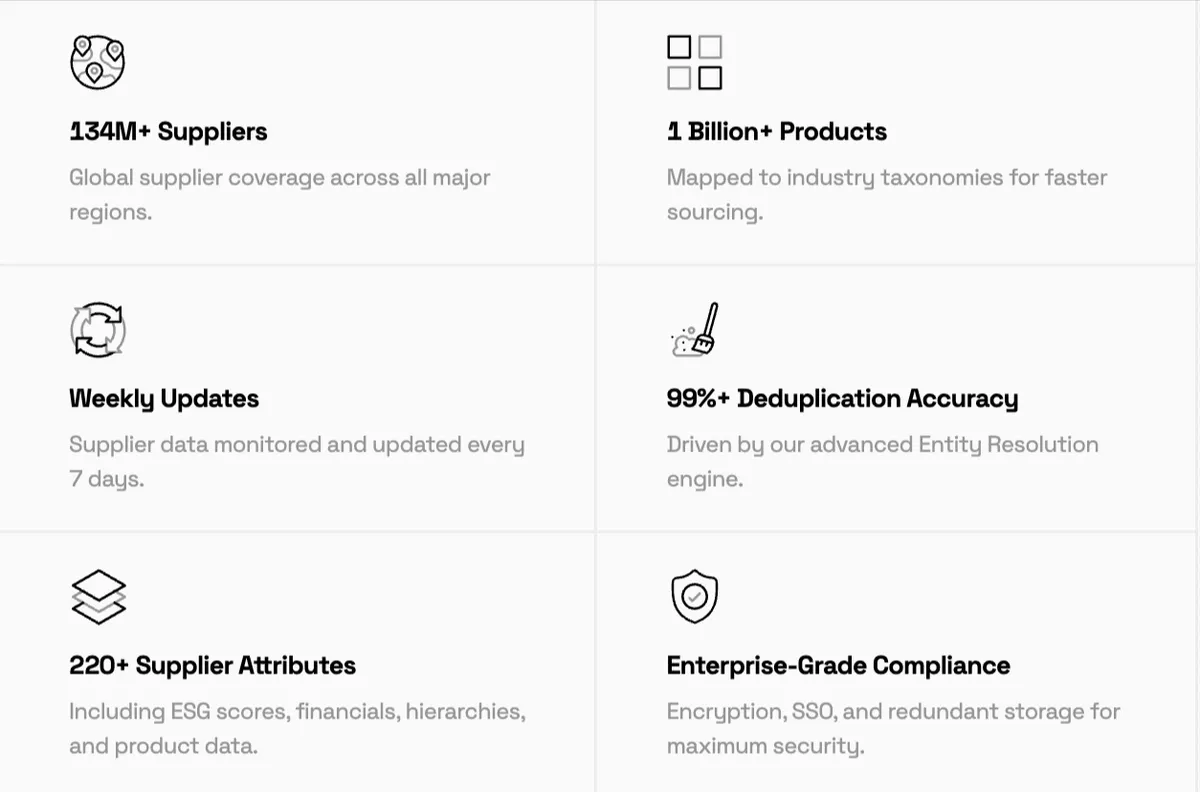
Source: Veridion
Our database currently covers 693M companies across 250 countries and territories, with more than 1.3B products and services indexed.
A team tracking a few hundred suppliers can do it by hand. A platform built to watch hundreds of millions of companies needs a system that never stops reading.
Fresh data is just the starting point. The harder part comes next, which is turning that into signals a model can actually use.
Pulling Meaningful Signals out of Messy Information
Raw data doesn't warn you of anything on its own.
You also need to turn messy, unstructured noise into clean signals that a risk model can use. AI is perfect for that.
The technical term for this is information extraction, and it runs on natural language processing (NLP). Traditional NLP has been in enterprise use for over a decade.
Large language models changed what's possible. Older systems needed hand-labelled data and rigid rules to catch something like a shipment delay or a leadership change.
LLMs can now read a filing, spot the entities involved, tag the type of event, and pull out dates, amounts, and locations, all in one pass.
In 2023, predictive AI systems helped automotive manufacturers avoid more than 75 factory stoppages.
Hurricanes, material shortages, and capacity constraints were flagged 3 to 7 days before they hit.
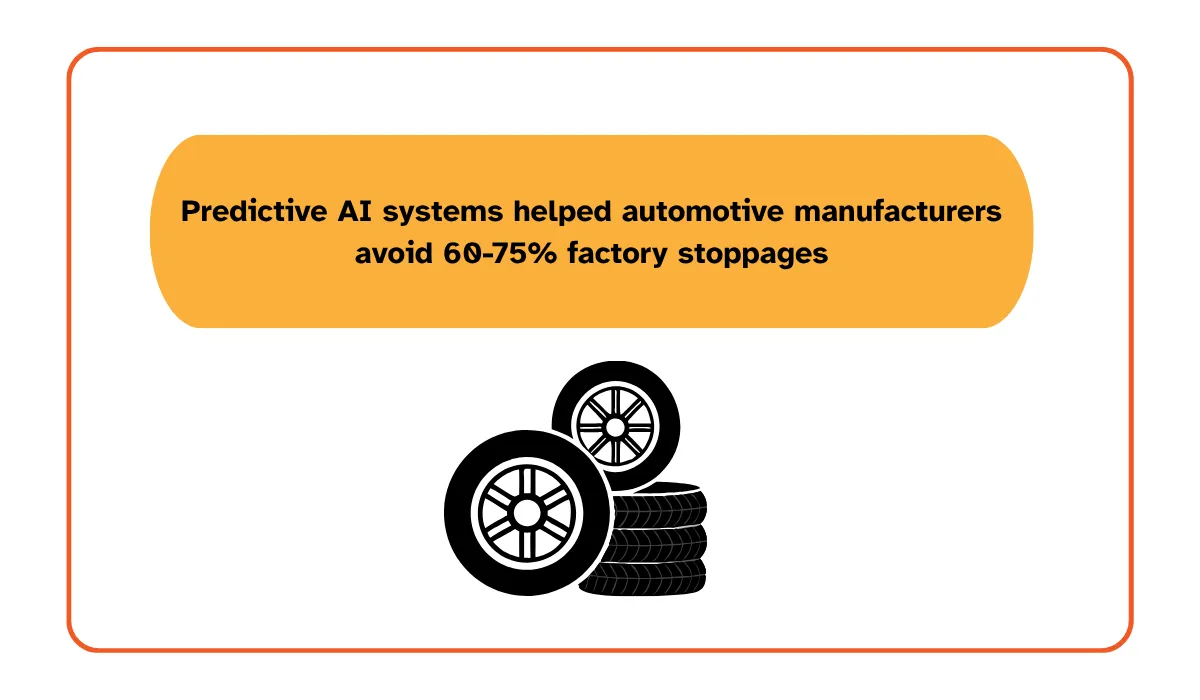
Companies using this kind of monitoring report avoided 60 to 75% of unplanned stoppages a year.
That accuracy is exactly what makes real-time monitoring viable at enterprise scale.
When you're scanning millions of sources a day for signals that could affect thousands of suppliers or portfolio companies, even a small drop in accuracy matters.
You either miss real risks or drown in false alerts. Neither is cheap.
Uber, a global mobility company’s Finance Risk Management team offers a concrete example of how this works in practice.
Adam Frank leads the team as Deputy Head, and Ramesh Raju runs data, automation and AI on the FRM Compliance Tech side.
They described their approach in an interview:
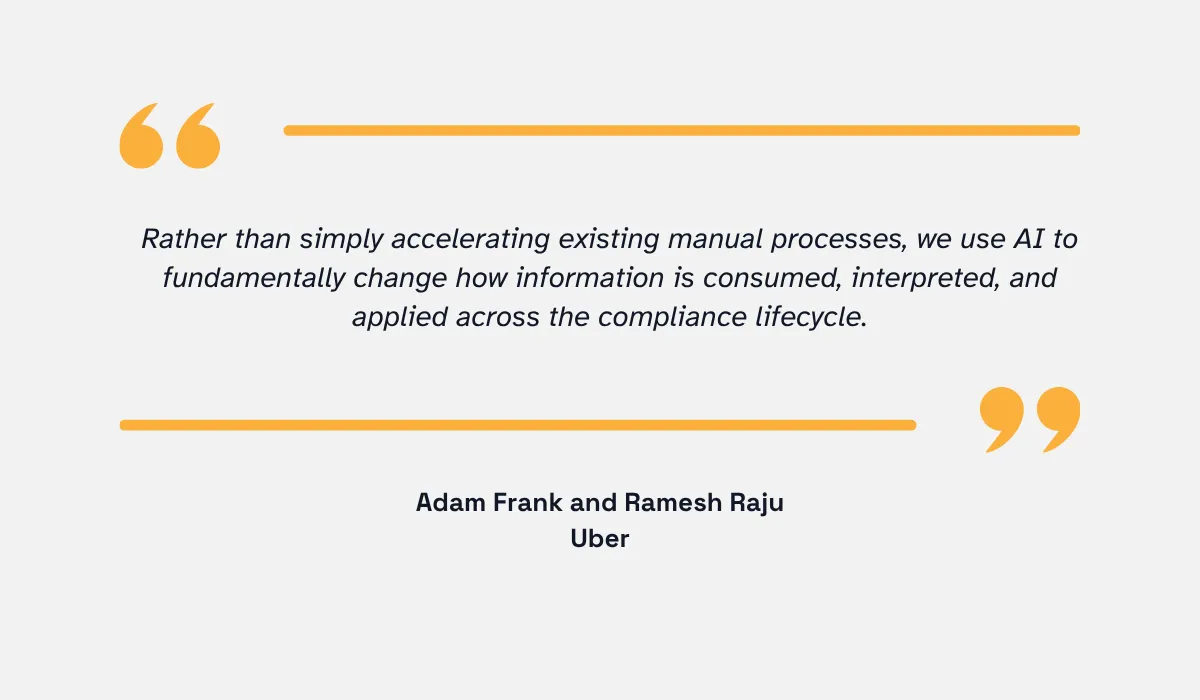
The Uber team calls this a shift from step-automation to meaning-synthesis. That shift is why LLM-based extraction can catch hidden risk signals that rule-based systems miss.
Like maybe an offhand remark in an analyst call or a change in tone across a supplier's filings or a shift in how a regulator talks. These signals used to slip through but now they show up in near real time.
For a risk model watching enterprise supply chains, it is an excellent idea.
It's the difference between catching a supplier's money trouble hidden in a filing, or missing it because the model was only looking for big news.
But a signal isn't a risk on its own. To know if it matters, the model needs a baseline.
Detecting Anomalies Before Anyone Else
Fresh signals only become useful once a system can tell which of them are out of the ordinary.
This is what separates monitoring from noise, and it is where machine learning earns its place.
An anomaly-detection model starts by learning what normal looks like for a specific company.
Once it has that baseline, every new observation gets measured against it, and anything that drifts far enough from the pattern gets flagged for a closer look.
The reason this beats a fixed rule is that normal is different for every company.
A young software firm that doubles its headcount in a year is behaving exactly as expected.
However, a stable industrial supplier that doubles its headcount in a year is doing something that deserves attention.
A model built on each company's own history and its peers can tell those two apart. A single threshold applied to everyone cannot.
The edge is speed and reach.
A human analyst might catch an odd number in a supplier they happen to be reviewing that week. A model watches thousands of suppliers at once, every week, and surfaces the small deviations well before they grow into something a person would notice on their own.
A March 2025 study published in EMAN Research surveyed 400 cybersecurity and IT professionals.
It was found that 68% of organizations already use ML-based anomaly detection for threat prevention. The financial services sector was leading at 75%.
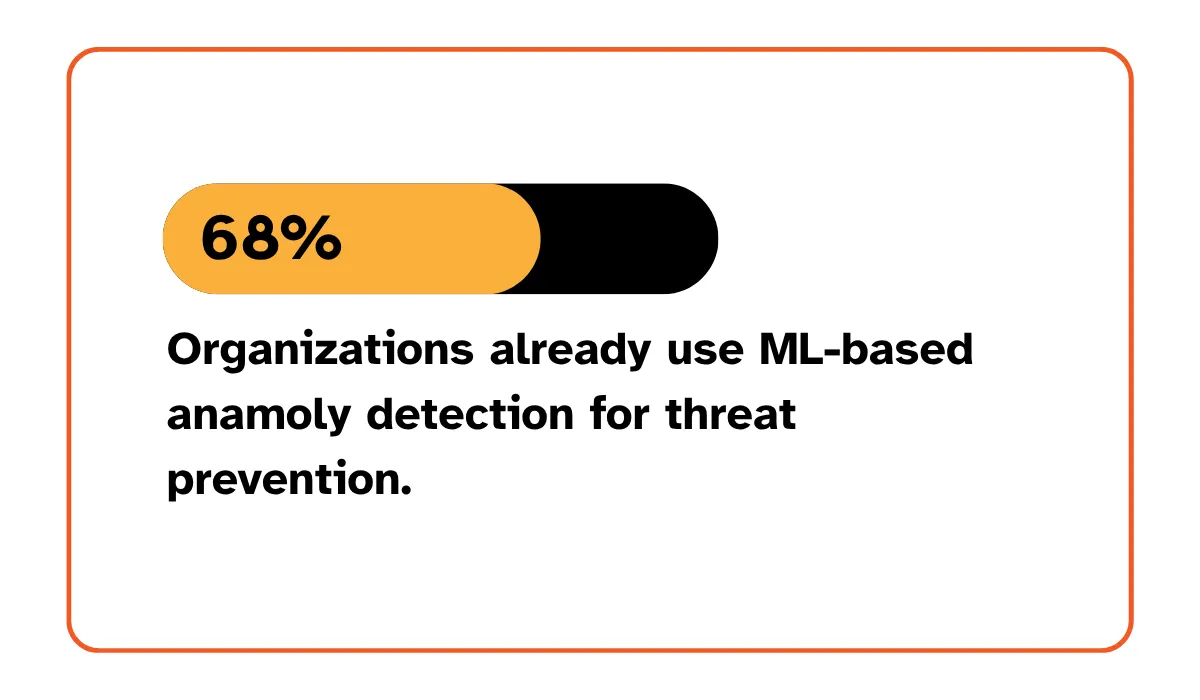
The same study found that 60% of respondents cite data imbalance as their top challenge. It means most systems still struggle when true anomalies are rare compared to normal activity.
But knowing a company has the tech doesn't tell you how they use it.
The 2026 EY Global Risk Transformation Study found real-time risk response is one of the biggest gaps between risk strategists and traditionalists.
Forty-three percent of strategists use AI for it, versus 31% of traditionalists. That twelve-point gap is where the edge now lies.
Every risk team eventually picks a baseline, like individual, sector, or hybrid.
- Individual baselines catch subtle changes but need history.
- Sector baselines work faster but miss company-specific patterns.
Hybrid models, which compare a company to its own history and a live peer group, have become the standard for supplier and vendor risk.
Sensitivity makes or breaks most projects. If it’s too tight, alerts pile up fast. When it’s too loose, the model only catches the obvious stuff.
An isolated anomaly, though, is just a data point. The real work begins when the model starts connecting them.
Turning Anomalies into Risk Narratives
This is where graph-based risk modelling, a method that evaluates danger by mapping relationships, comes in.
Instead of scoring each anomaly in isolation, modern systems treat companies, suppliers, geographies, and events as nodes in a network.
Several weak signals can cluster around the same company shortly. A delayed shipment, rating downgrade, regional headline, or a competitor's earnings warning.
The system doesn't just alert on each one. It links them into a single hypothesis about what's happening.
The stakes for getting this right are higher than a decade ago.
The World Economic Forum's 2025 Global Risks Report ranked armed conflict as the top immediate global risk. Nearly a quarter of leaders surveyed named it their biggest concern.
Misinformation and cyber threats came right after.
Each of those risks spreads through supplier networks and market chains, and pattern linking is built to catch that spread.
But catching it is only half the job. The other half is knowing whether the path is real or just a coincidence.
This is where the technical work gets interesting.
The challenge behind pattern linking is separating correlation from causation.
Two supplier events in the same week might share a cause, or they might just be a coincidence.
Causal inference layers sit on top of graph models and weigh connections by history, not just by what happens to occur together.
A 2025 study in the International Journal of Production Research applied causal machine learning to supply chain risk in the maritime sector.
It found that causal models beat correlation-only approaches when the goal is planning a response, not just flagging a disruption.
Dan Diasio, EY Global Consulting AI Leader, described the shift in the 2026 Risk Transformation Study:
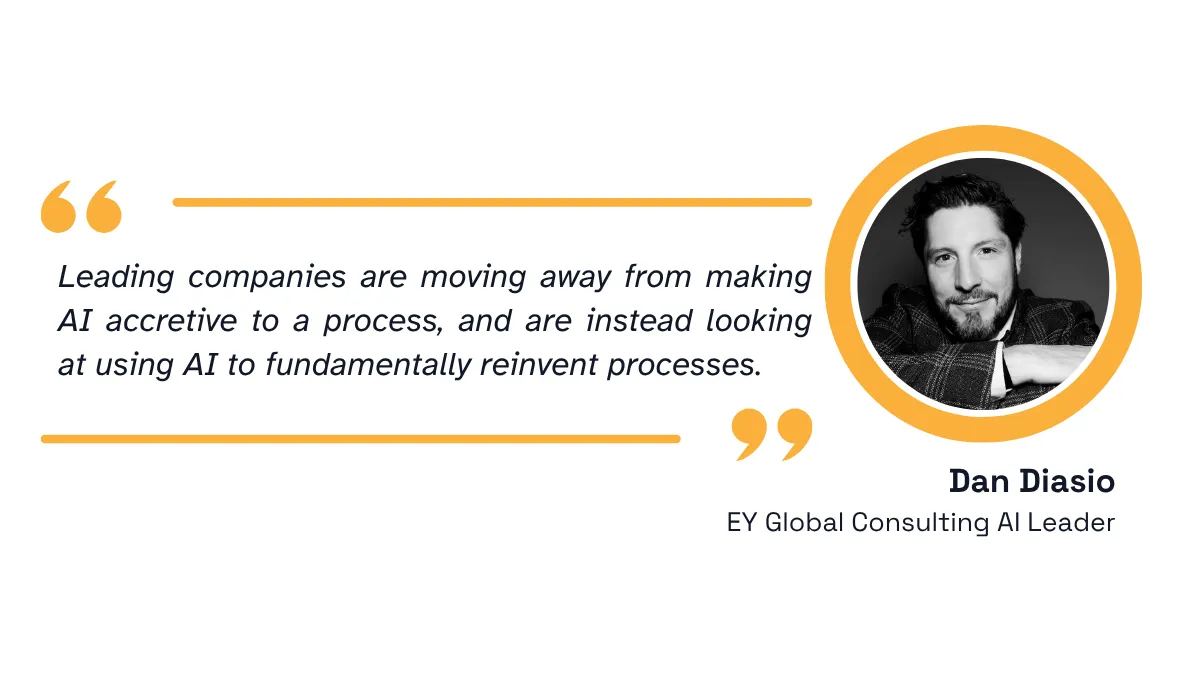
The same study points to a large European automotive manufacturer as a clear example.
Its multi-agent AI system runs about 15 specialized agents, each watching a different region. A coordinator agent connects their findings and cuts out duplicate alerts.
It worked as the team's system spotted a possible problem early. If the Strait of Hormuz closed, it could disrupt the helium supply. They caught this risk before it made the news.
This is pattern linking in practice. No single input mentioned helium and manufacturing together.
The connection came from linking three separate threads. A geopolitical development, the chemistry of production, and the company's own supplier map.
Each agent handled one thread while the orchestrator pulled them together. The output was a specific, actionable risk narrative rather than a hundred unconnected alerts.
Weak signals combining into strong predictions is the capability that separates continuous risk detection from continuous alert generation.
Let’s move toward the next step which is measuring how bad the risk is.
Estimating How Serious the Risk Is and Whether It Will Escalate
Risk scoring tells you not only what the risk is, but what you can expect from it.
It converts qualitative signals into quantitative estimates of:
- probability
- expected severity
- time horizon
- cascade potential
Probabilistic risk forecasting is the technique behind this. Instead of a plain "risk found" or "no risk found," models return a range of chances.
A 2026 study on forecasting supply chain disruptions trained large language models to read real-time news and turn it directly into probability estimates of a future disruption.
The model not only flags a risk but also estimates how likely that risk is to actually happen. The approach was found to be better than existing methods.
Time-to-event models also add a timeline on top of that probability. This lets teams tell the difference between a supplier crisis they need to fix tomorrow and one that gives them time.
Interos, for example, a supply chain intelligence company, builds a predictive intelligence platform used by Mastercard, Google, L3Harris, and the US Navy.
Its i-Score methodology scores supply chains across six areas, including ESG, cyber, financial, restrictions, geopolitical, and catastrophic risk.
They use thousands of data points per supplier, benchmarked against industry norms.
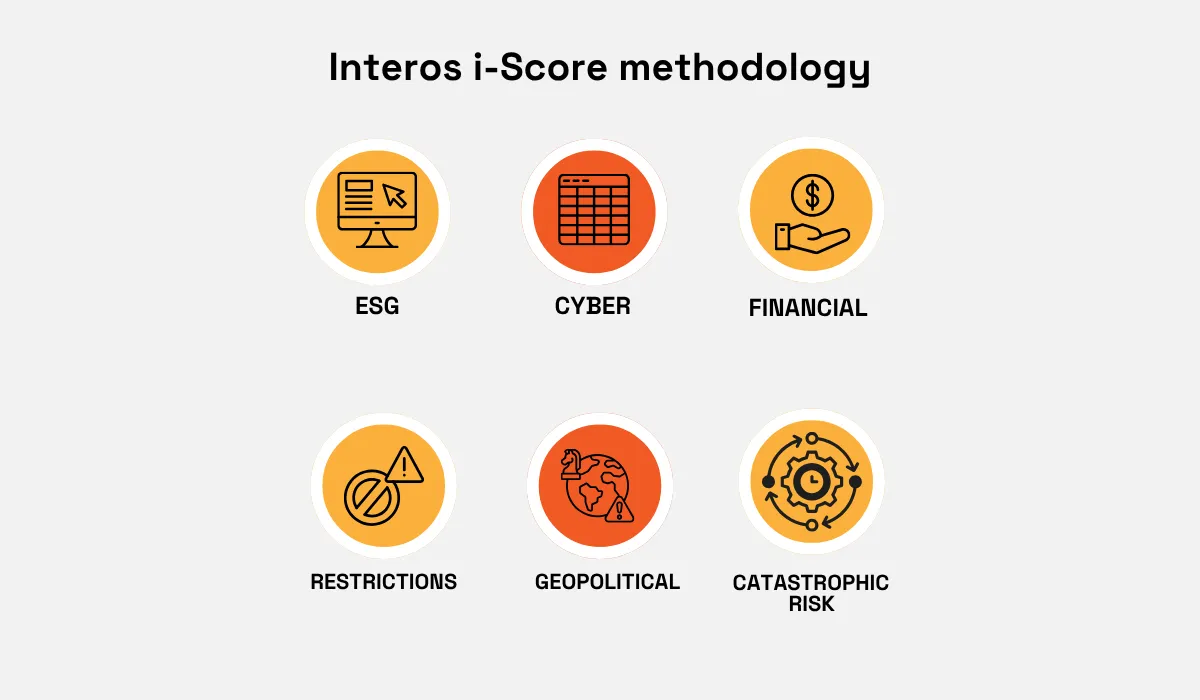
Scoring one supplier alone is easy. The real test is scoring a whole chain of suppliers whose failures could cascade.
The classic worry in enterprise risk is a chain reaction. A Tier-1 supplier is missing a delivery or a production line is slowing down. Revenue sometimes takes a hit two quarters later.
Traditional scoring treats these as separate events. Modern scoring treats them as one chain and calculates the odds of it playing out before any link breaks.
Once the model has put odds on a risk, the call it hands back to a person is a judgment between options that are all defensible.
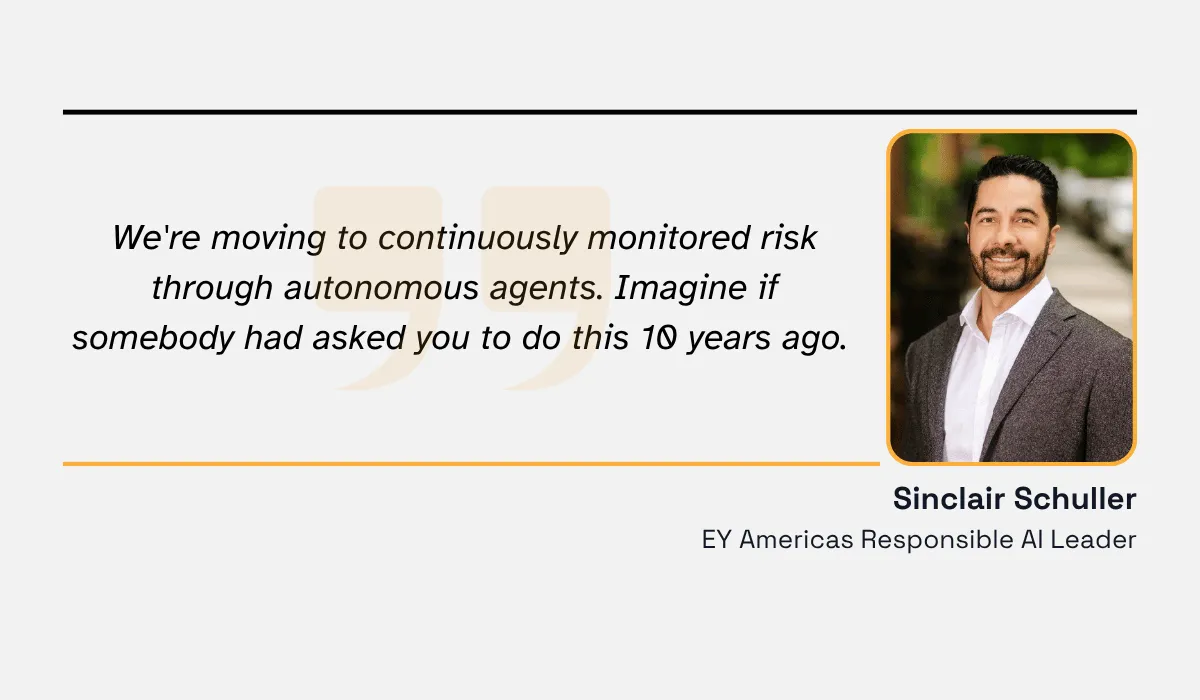
Sinclair Schuller, EY Americas Responsible AI Leader, describes how that division of labor between machine and human is shifting in EY's 2026 Global Risk Transformation Study:
The public sector is moving the same way. The 2025 GAO report on Defense Industrial Base risk gave the Department of Defense three recommendations.
It was to
- Share supply chain data across separate systems
- Assign clear ownership for adopting commercial best practices
- Use contracts to get country-of-origin data.
The report also found that DOD officials already use commercial supply chain tools that pull from SEC filings, bills of lading, press releases, and government sources.
The GAO told the world's largest procurement organization to start using commercial risk tools. So the question isn't whether to adopt continuous risk detection, it's how fast.
Every quarter of delay is a quarter your competitors use to build muscle memory around models that improve with every observation.
Conclusion
None of this matters if AI just fills someone's inbox with more alerts.
The real shift is timing.
AI looks at data as it comes in right away, and not weeks later. It learns what's normal for a company. Then it notices when something breaks that pattern and figures out how serious it is.
That earlier warning is the whole point. A team that spots a problem early has time to act on it. One that find out too late is just cleaning up the mess.
Not every company will make this shift at the same pace. But the ones that do will simply know about problems sooner than everyone else, including their competitors.
Articles
Discuss how these trends affect your organization.
Our analysts are available for a short call. Bring a specific question and we will ground it in the data.
Insights
Keep reading
More analysis, research, and outcomes grounded in live company intelligence.
The Hidden Cost of Stale Supplier Intelligence
Are you missing crucial signals to identify emerging market risks? Stale supplier intelligence can cost you dearly. Uncover the hidden dangers.
6 Best Market Intelligence Tools
Discover six top market intelligence tools and find out which one fits your company’s data strategy best. Read the full comparison here.
What Is the Difference Between Business and Market Intelligence?
Not sure whether you need business intelligence or market intelligence? This article compares them and shows when to choose each.