Insights / Articles
How to Validate Alternative Data Before It Enters a Commercial Credit Scoring Model
Sound alternative data validation confirms a field is matched to the right company, stable over time and free of leakage.

- Fields need leakage tests to prevent leaking future information into a scoring model.
- B2B match rates typically range from 60% to 80%, so entity resolution needs validation.
- Random gaps reduce a model's statistical power, while systematic gaps bias it.
- A field that validates suspiciously well often has a leakage problem, not a breakthrough.
Every year, more alternative data enters commercial credit scoring models: web signals, registry updates, operational footprint indicators, digital payment proxies, and more.
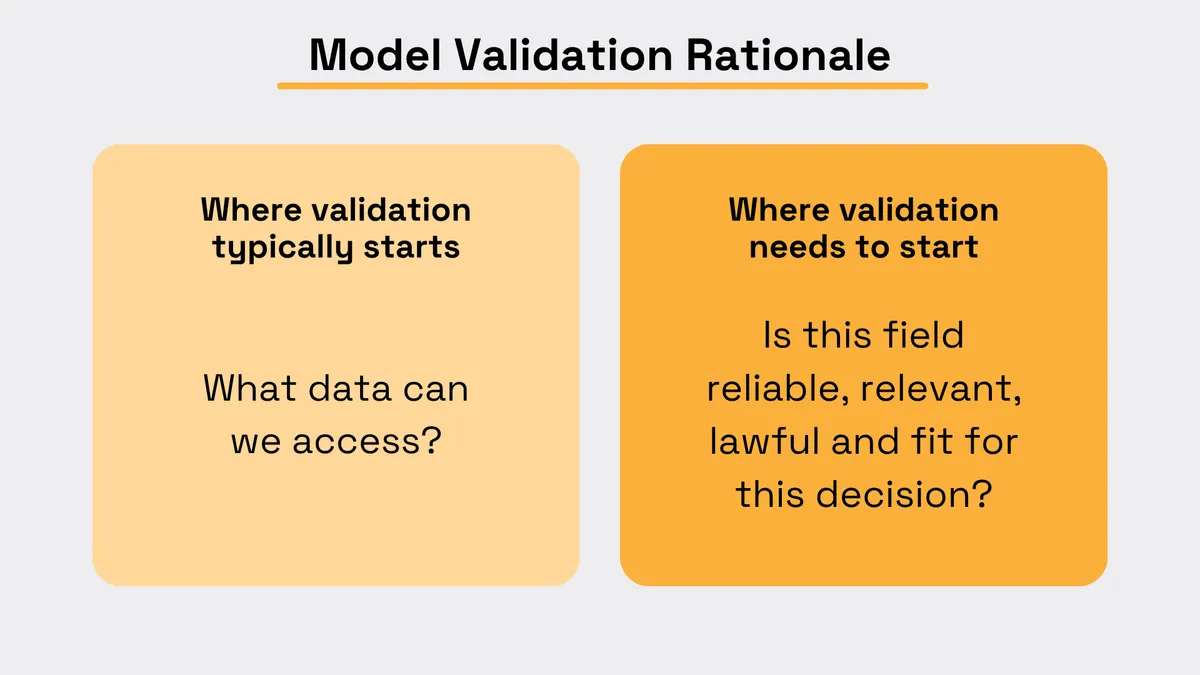
The question data teams usually ask first is what data they can access.
But the questions that actually protect a credit scoring model are different.
You need to ask whether you can demonstrate that this field is reliable, relevant, lawful to use, and fit for a specific decision.
Answering that takes a validation sequence, not informal judgements.
In this article, we’ll see what this sequence looks like.
1. Define the Decision the Field Must Inform
A field only matters in context.
Before you begin any sort of statistical test on your field, document what specific decision the information you have will affect: origination decisioning, limit setting, pricing tier, or early warning.
Teams that skip this step will validate abstractly. They will ask "Is this data good?" instead of "Will this data make this specific decision better?"
Model validation must tie to a stated purpose and intended use, not a general quality check.
Source: Veridion
Without a decision statement, teams waste weeks on correlation testing that turns out to be irrelevant because the field captures a metric adjacent to, but not relevant to, what the decision relies on.
Worse still, months after implementation, teams realize no one had tested the field against the actual population, timeframe, and cutoff that the decision depends on.
Before you start testing your field, try to write a single sentence like the following examples:
- This field will influence the initial risk tier for thin-file small and medium-sized enterprise origination.
- This field will trigger a review of an existing account in the quarterly portfolio review.
Afterwards, tests like coverage, stability, leakage, and correlation should be measured against that sentence, not against the data in isolation.
Additionally, test the field only for the population and time period you need.
If you later reuse the field in another decision, treat it as a separate validation, not as a rerun of the first one.
2. Verify Entity Resolution
A brilliant field attached to the wrong company is worse than no field at all.
So, before you evaluate any statistical property of a new data source, confirm that the records are matched to the correct legal entity.
This check has to come first in the sequence, as every downstream test inherits whatever error rate exists in the matching layer.
Here's why this matters more than it might seem.
Company entity resolution is hard: legal name variants, Doing Business As (DBA) names, subsidiary structures, and address changes create ambiguity that a simple string match cannot resolve.
If your matching layer runs at even a 10% false-match rate and you then test correlation or stability on that data, you are measuring noise without realizing it.
In fact, the test will most likely report an incorrect number, but it will look exactly like a valid result.
Flawed entity resolution directly undermines model governance because true validation depends on clean entity linkage.
As data quality research from the Federal Reserve Board on credit scoring systems notes:
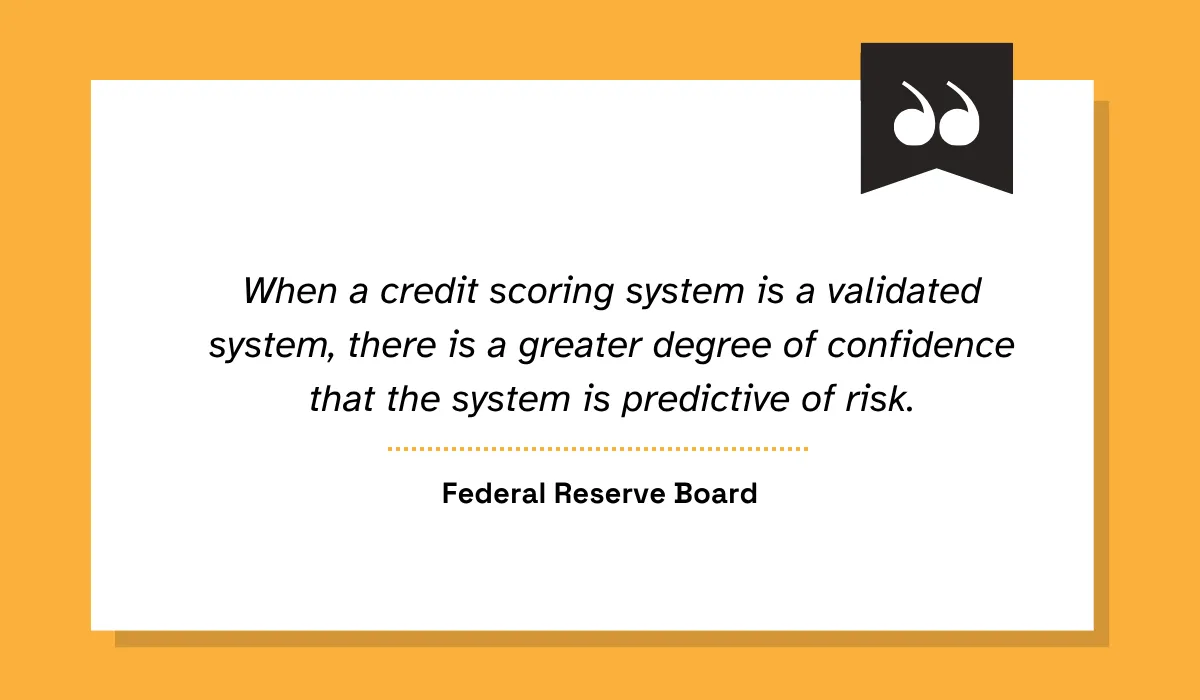
Illustration: Veridion / Quote: Federal Reserve Board
So, spot-check the entity resolution before testing further.
Take a random subset of matched records and cross-check it manually using a reliable source like a corporate registry.
Watch for name conflicts as businesses with nearly identical names across jurisdictions or countries are a significant cause of mismatch.
Track both the match rate, or how many records got matched, and the false-match rate, or how many of those matches are wrong.
After all, a data source can look complete on the surface while attaching the wrong firmographics to a meaningful share of your file.
Only after both statistics pass your threshold should you proceed with coverage, stability, and correlation checks.
3. Measure Coverage and Missingness
Once you are sure a field is connected to the right businesses, the next step is to assess what portion of your target population it covers, and which population is missing.
A field present for 70% of your portfolio sounds fine until you learn the missing 30% clusters entirely in one geography or one size band that matters disproportionately to your risk exposure.
The most important distinction here is whether missingness is random or systematic.
When a field is missing at random, the gap has nothing to do with company outcomes and it mostly costs you statistical power.
What biases the model is when missingness is systematic.
That means gaps concentrate in specific geographies, sectors, company sizes, or, worse, correlate with the outcome itself.
As an example, consider this study on corporate carbon disclosure, where it was found that only around 65% of companies report their emissions.
The researchers concluded that the missing 35% is most likely not missing at random, since disclosure is voluntary.
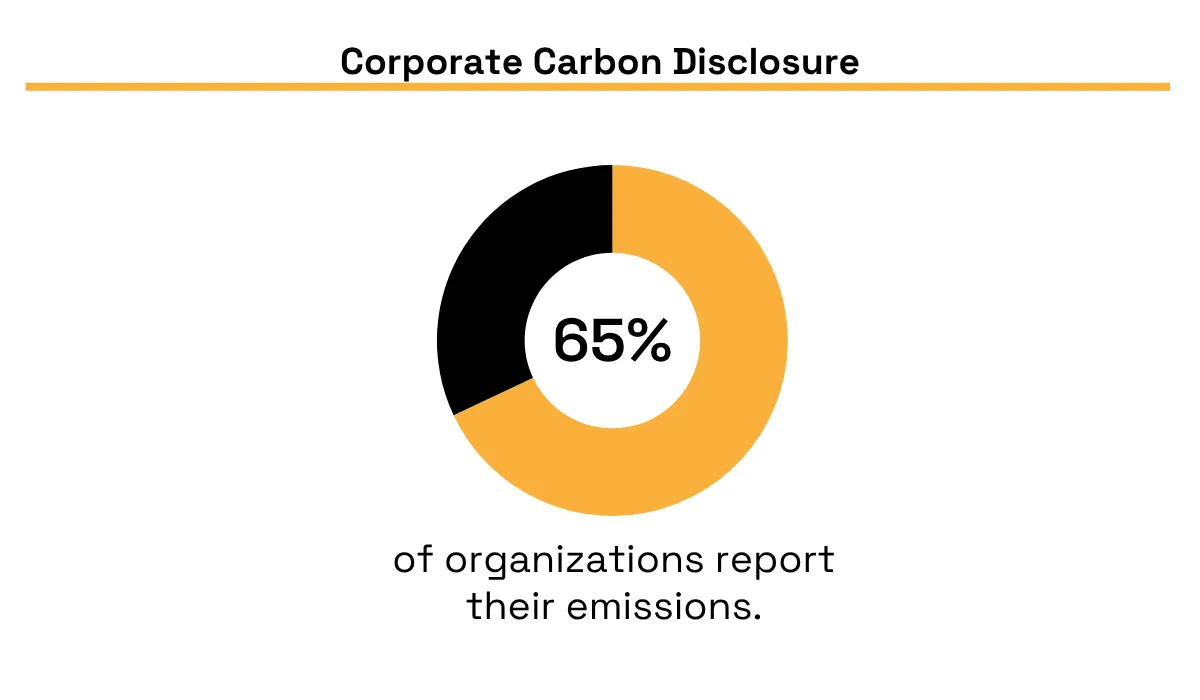
The same logic applies to alternative company data: coverage gaps often trace back to a company characteristic, not to chance.
A field that is well-populated for large public companies but sparse for small, minority-owned, or rural businesses will not show up as an obvious quality flaw in an aggregate coverage number.
It becomes visible only when you slice missingness by segment.
No single threshold disqualifies the entire field. Rather, we want to define a coverage threshold relative to the decision made in step one.
Start by cross-tabulating missingness against geography, sector, company size band, and the outcome variable itself.
If missingness is concentrated in one segment, see whether adding imputation around the gap improves model performance or fairness metrics in that segment rather than overall metrics.
Should adding imputation significantly impact the approval rate or error rate of the impacted segment, that change serves as a stronger basis for excluding the field in the segment or across the entire population than any coverage-threshold figure.
Record both the threshold and the rationale because the regulator or auditor will want to know why 70% coverage, for instance, is acceptable for one field but not another.
4. Test Stability and Refresh Behavior Over Time
A field may appear predictive from a single snapshot but still fail when deployed because the underlying distribution shifts between refresh cycles.
Stability testing catches this type of failure.
Population Stability Index (PSI) is a common statistic that measures the degree of distribution change between two periods using binned population percentages.
In a recent technical development that has defined the PSI within an information-theoretic framework, the commonly used interpretation bands are the following:
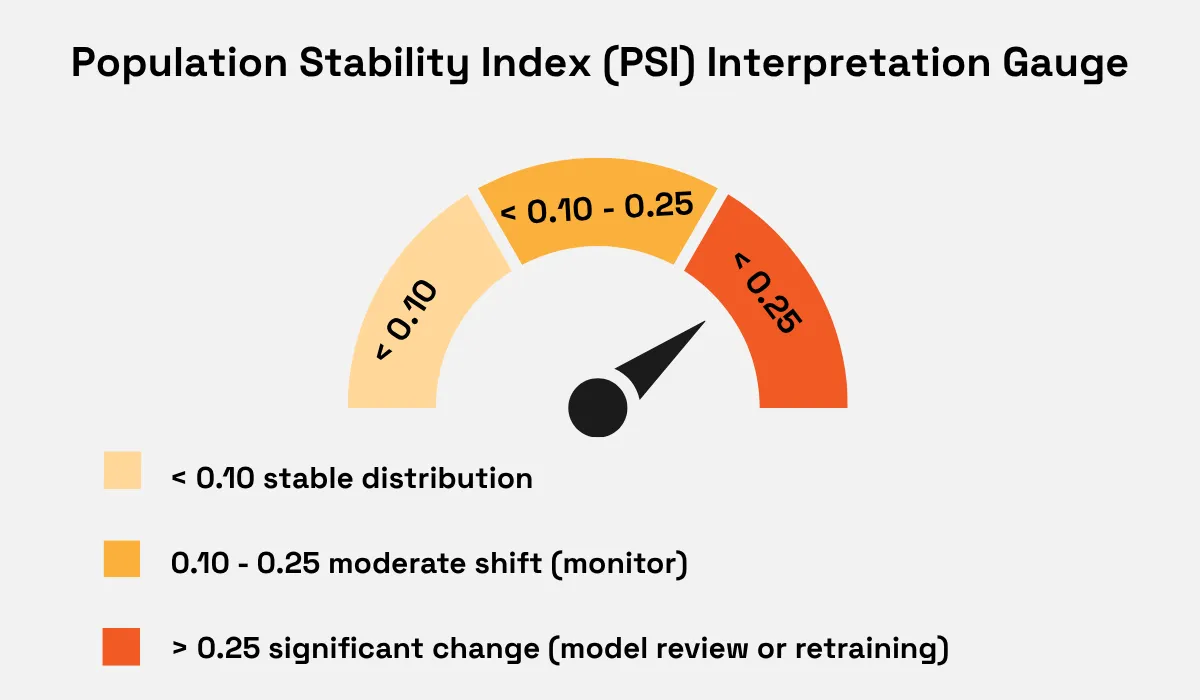
Applied research on population stability testing for credit scorecards reinforces that PSI should be run on a rolling basis, not as a one-time check at onboarding.
In fact, a field can pass initial stability testing and still drift six months later as the underlying vendor methodology or market conditions shift.
This is exactly why any structured company-data source you use should be scrutinized.
For example, evaluating a continuous data provider like Veridion illustrates how refresh cadence and attribute-level history can be evaluated using PSI testing.
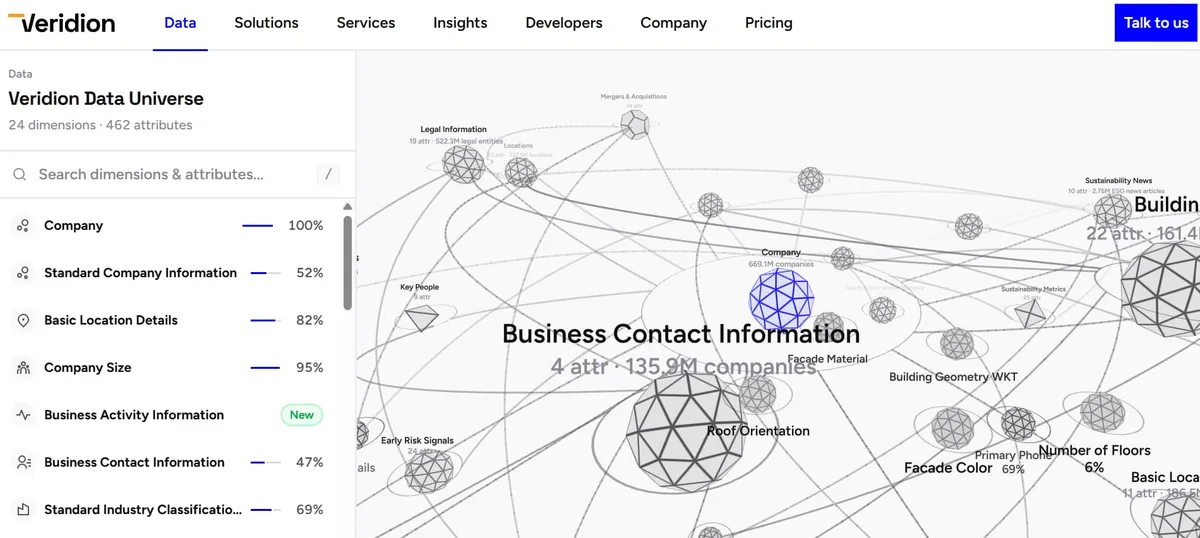
Veridion's company graph refreshes continuously with data from every active company worldwide, with hundreds of firmographic signals per company.
Source: Veridion
Although continuous updates like these avoid the sudden "batch shock" drift from quarterly vendor dumps, model risk teams still need to validate the PSI across rolling periods to ensure periodic field updates maintain a consistent distribution.
This is because a vendor's claimed frequency (weekly, monthly, or quarterly) describes its data update cadence.
It doesn't mean the field you built from it will be as stable as implied.
Test it directly: pull the field's distribution at three or four points over the past year, calculate PSI between each consecutive period, and confirm the observed stability matches what the refresh documentation implies.
If it doesn't, the vendor's refresh cadence and your model's actual stability requirement aren't the same thing, and you need to know that before the field reaches production.
5. Check for Leakage and Look-Ahead Risk
For each field, there is only one question that matters:
Was it possible to know this exact value at the exact point when the credit decision was being made?
If you cannot answer that with certainty, treat the field as leaking future information into a decision made earlier.
Look-ahead bias is one of the more insidious failure modes precisely because it inflates validation performance rather than degrading it.
Lucas Inglese, a professional independent quantitative researcher, notes that look-ahead bias is not a minor technical slip.
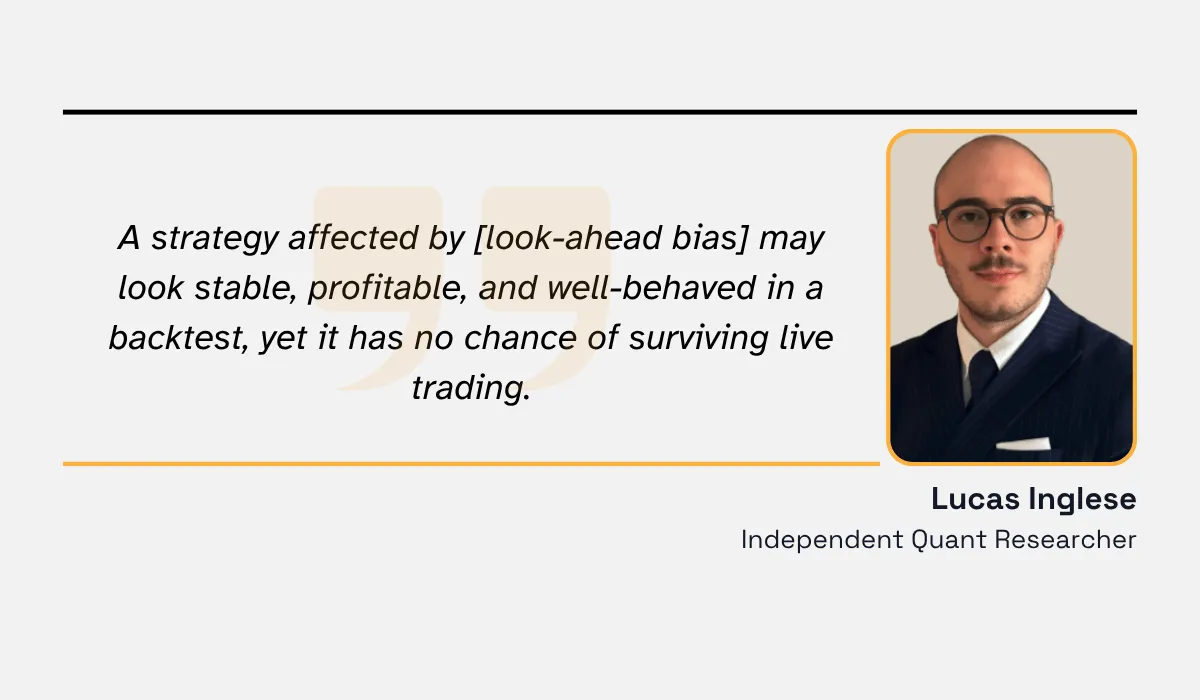
He explains that it directly violates temporal realism by feeding the model information it could never have had at the time of the decision.
A feature computed using information that only became available after the decision point will show artificially strong backtested performance.
This is because the model is effectively given the outcome during validation, only to fail or underperform once deployed against real-time data.
For credit-oriented alternative data, this leakage often appears in aggregate statistics: a "12-month average revenue" field calculated when the model was trained might use a full trailing year, but at the time of the historical loan decision, that year had not yet fully elapsed.
You want to timestamp everything and rebuild the field using only data available as of the decision date, not the data pull date.
For every candidate field, reconstruct its value using a point-in-time snapshot methodology: take the field's value exactly as it would have existed on the historical decision date, not as it exists today with the benefit of hindsight.
The difference between the "current snapshot" version of a field and its point-in-time version shows how much leakage the field contains, and a significant difference should be treated as disqualifying evidence.
6. Test Correlation Without Assuming Causality
A field can correlate strongly with default risk and still be the wrong field to use, because correlation alone does not tell you why the relationship exists or whether it will hold once the model is deployed at scale.
Scrutinizing why that correlation exists is therefore vital.
Information Value (IV) is the standard metric credit teams use to quantify a variable's predictive strength before it enters a scorecard.
Interpretation thresholds of this metric are fairly consistent across credit risk literature:
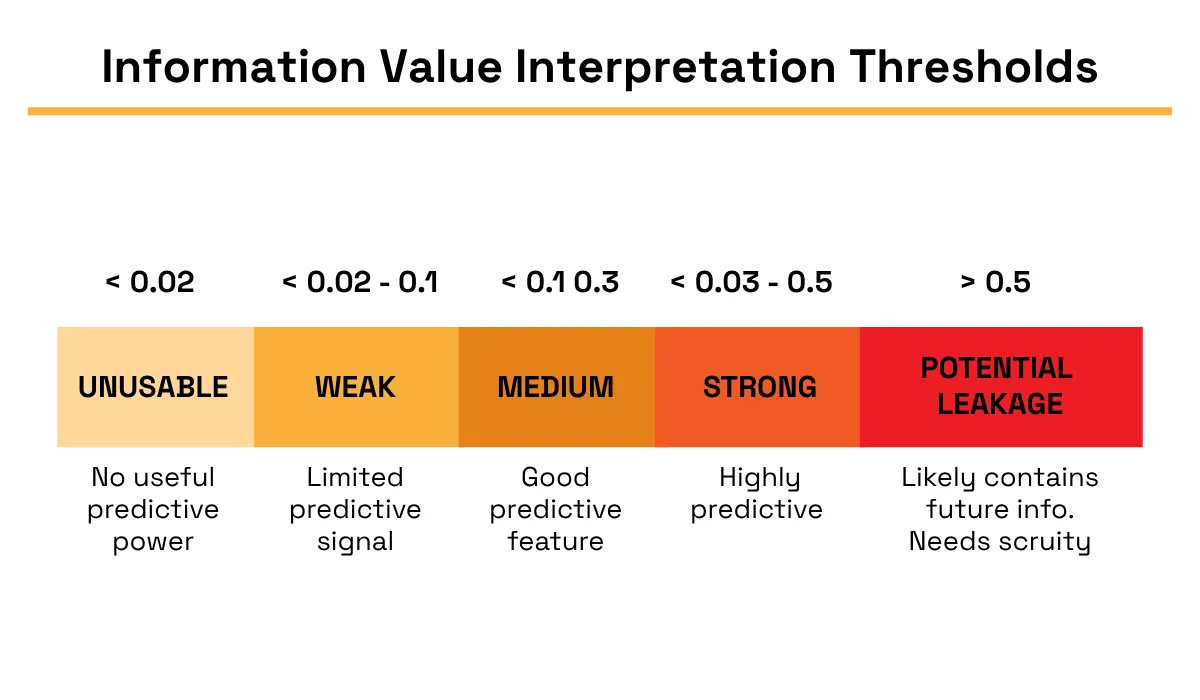
Illustration: Veridion / Data: Listen Data
The band above 0.5 matters directly here, because a field with an implausibly high IV is frequently a leakage problem in disguise, which is why steps five and six should be read together rather than treated as sequential and independent.
Beyond target leakage, an even subtler danger is that a field might score highly on IV when the statistical relationship is merely seasonal, contextual, or even a proxy for another signal.
To guard against both spurious correlations, write down the mechanistic story for why the field should predict a specific decision.
A stable and active digital footprint possibly correlates with operational continuity, which reasonably correlates with repayment capacity: that's a defensible chain.
If you can't articulate a comparable chain, consider the correlation a red flag and test accordingly.
Conclusion
While running this whole sequence may require serious effort, skipping one step means trading initial work for bigger risk later.
In fact, a field that looks validated on paper can secretly throw off decisions in production.
So run the sequence in order, document what each step finds and build it into your onboarding process
Every new data source you evaluate afterward should get faster, safer, and easier to defend.
Articles
Discuss how these trends affect your organization.
Our analysts are available for a short call. Bring a specific question and we will ground it in the data.
Insights
Keep reading
More analysis, research, and outcomes grounded in live company intelligence.
How Credit Rating Agencies Can Use Alternative Data When Private Company Financials Are Sparse
Alternative data for credit scoring keeps a private-company credit view current between filings, using activity, headcount, and hiring.
Market Intelligence: Use Cases Across Departments
Want to make better decisions across departments? Learn how market intelligence use cases apply to your entire organization.
Key Differences Between Competitive and Market Intelligence
Discover the key distinctions between market and competitive intelligence - so you can apply the right approach in your strategy.