Insights / Articles
7 Problems with Company Financial Data APIs for Private Companies
Company financial data APIs often return private-company figures that are stale, estimated or tied to the wrong entity. Seven problems to plan for.

- Private-company financial fields can be missing, modeled, or estimated rather than officially reported.
- A populated financial field doesn't confirm the underlying figure is still current.
- Accounting standards, fiscal calendars, and currencies make comparable-looking figures measure different things.
- Entity changes and missing operational context attach financial data to the wrong company.
You pull a private company's latest financials into your underwriting system.
The API returns revenue, profit, and a reporting period. The record looks usable.
Then you look closer.
The financials may describe a period that ended months ago, or a corporate reorganization may have left the figure attached to the wrong entity.
Each problem can leave the field populated, which makes private-company financial data harder to evaluate than an API response suggests.
Before using a figure in a model or decision workflow, you need to understand what it represents, how current it is, where it came from, and whether it still belongs to the business you are analyzing.
This article examines seven problems that can undermine that process.
Sparse Filings Create Unusable Data Gaps
A financial data API cannot return authoritative financial information that a private company has never disclosed.
Companies that make financial information publicly available tend to fall into specific regulated categories.
These include:
- Insurer
- SEC-reporting Companies
- Banks and Credit Unions
- Nonprofits
Most private companies, however, have no general obligation to publish revenue, assets, liabilities, or other financial statements.
In the US, the obligation to publish financials depends mainly on how widely a company's securities are held, not on how big the business is.
A private company only has to register and report once it passes both an asset threshold and a threshold for the number of shareholders of record.
Cargill shows how far this can go.
The largest privately held company in the US reported $154 billion in revenue for fiscal 2025, yet it is not required to publish that figure through a general private-company financial reporting obligation.
Cargill makes limited financial information available voluntarily through its own reporting.
Even when a private company does disclose financial information, the coverage varies significantly from one company to another.
One company might publish revenue but omit profitability figures, while another might disclose employee and facility counts while providing no publicly accessible financial statements at all.
The fields available for one company don't exist for another.
The dataset therefore contains revenue for one borrower, operating expenses for another, and no financial figures at all for a third.
This reduces the number of companies analyzed because if a model requires several financial variables, a company with missing values for one or more of those fields can be excluded from the usable dataset altogether.
Missing financial data should also not automatically be treated as random noise.
Source: Veridion
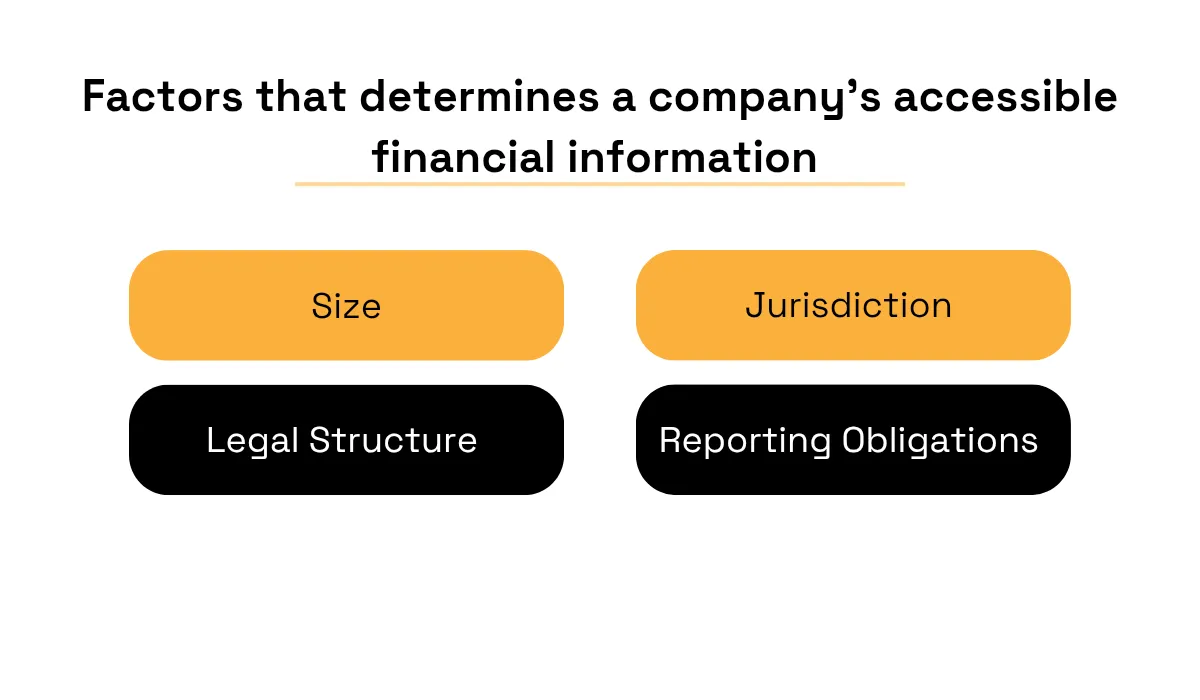
A company having accessible financial information depends on a variety of factors.
Reporting Delays Hide Current Risk
“Latest available” does not mean current.
The lag is built into how much of the private market reports.
MSCI notes that private credit funds mostly report performance quarterly and up to a full quarter late, so first-quarter results often don't surface until June.
Financials for the private companies behind those loans can lag even further.
So, a record labeled “latest” only confirms that it is the newest record the provider has received and processed.
It does not show how much the underlying business may have changed since the reporting period ended.
This can be easily missed by periodic financial information because some business signals remain deceptively stable until very late in the process.
When a portfolio-monitoring system is designed to flag changes in near real time, it cannot observe a change that the underlying data source has not yet reported.
The issue is therefore not simply if a value exists, but when that value was true and when the data pipeline received it.
Fixing it will need more than knowing when a record entered the API.
You'll also need the underlying reporting period and, where available, the observation or filing date to distinguish a recent financial position from an older figure that simply happens to be the latest one available.
Cross-Jurisdiction Differences Undermine Comparability
Two companies can report “net income” for the same year and still produce materially different measurements.
The accounting framework behind the figure changes what the number represents, and a financial data pipeline does not solve that problem simply by putting both values under the same field name.
Across international datasets, this financial reporting is governed by different frameworks and jurisdictional requirements.
The IFRS Foundation tracks how IFRS Accounting Standards are applied across 170 jurisdictions, and most of them require or permit IFRS for at least some companies.
The United States, by contrast, requires domestic issuers to report under US Generally Accepted Accounting Principles (US GAAP).
Sociedad Minera Cerro Verde, a Peruvian copper producer in which Buenaventura, a mining company, holds a 19.58% stake, reported 2024 net profit of $953.177 million under IFRS.
The reconciliation in Buenaventura’s SEC filing produces a US GAAP profit figure of $888.631 million for the same fiscal year, a difference of about $64.5 million.
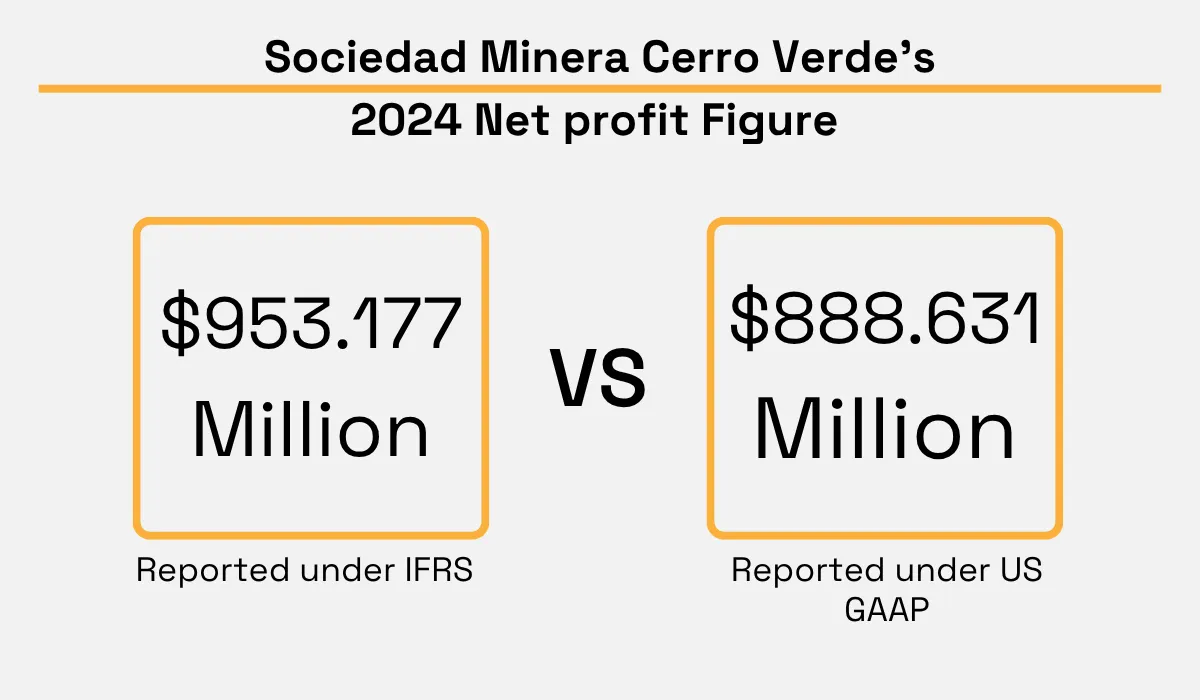
This difference does not mean one figure is incorrect. It shows that the accounting basis affects the meaning of the figure.
Cerro Verde prepares its statements under IFRS, so the filing includes notes explaining how its figures would differ under US GAAP.
The account filings are one thing; fiscal calendars also create another layer.
Take a company with a March year-end and one with a December year-end, both appearing in a dataset as having a “FY2024” result while their reporting periods cover different twelve-month windows.
Comparing their annual growth rates without retaining the underlying period introduces a timing difference into what appears to be a company-level performance difference.
Those differences affect the information available to your data pipeline and the context attached to it.
Some of those contexts include currency conversion.
A financial record reported in euros, dollars, or another currency needs a defined conversion basis before it enters a common-value field.
The rate and date used for that conversion become part of the resulting figure, particularly when a system compares annual results across companies operating in different currencies.
All of these details determine what your numbers are really measuring.
Stale Records Pass Through the Pipeline Undetected
A field with a value in it looks the same on day one as it does on day one hundred.
In a typical API response, a revenue figure verified two weeks ago and a revenue figure last verified two years ago arrive in the same format, under the same field name.
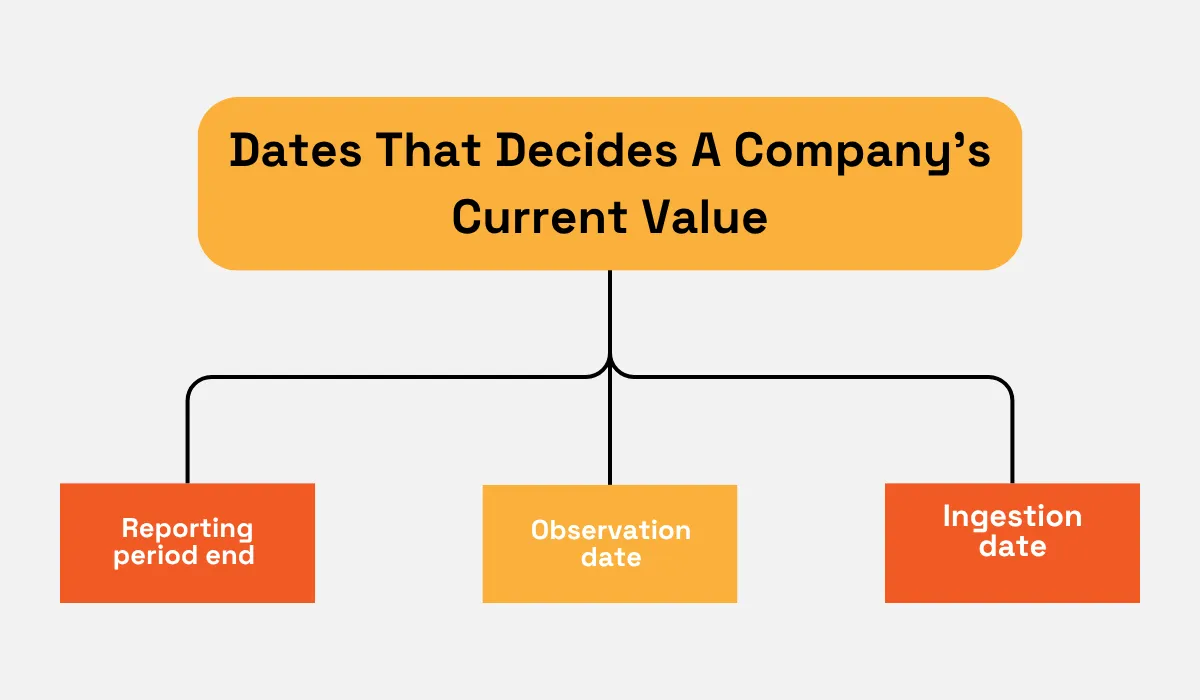
But there are three dates that decide how current a value really is.
Source: Veridion
The reporting period end shows which stretch of the company's life the number describes.
The observation date shows when the provider last confirmed the number against a source.
The ingestion date shows when your system received it.
Without all three attached to each field, it won't be easy to separate a value confirmed last week from one that was simply never updated.
The Federal Reserve's review of Silicon Valley Bank shows the same problem in a different setting: an assessment that stays unchanged while the business underneath it moves.
Supervisors rated the bank's governance as satisfactory every year from 2017 through 2021, even as they repeatedly flagged weaknesses in its risk management.
Between 2019 and 2021, the bank's assets grew from $71 billion to more than $211 billion.
When it failed in March 2023, it had 31 open supervisory findings, roughly triple the average for banks of its type.
The review concluded that SVB remained well-rated even as conditions deteriorated.
Supervisory ratings aren't public data, but the mechanism carries over directly: a field that keeps showing a stable value gives no signal of how long it has gone untested against what the business is actually doing.
This, though a common issue, can be worked around by storing each field with its reporting period end, observation date, and ingestion date, so your pipeline can calculate the field's age every time it is read.
Age alone, though, settles nothing, because the acceptable age depends on the field.
So each field type needs its own freshness threshold, set by how quickly that measure moves and how much weight the model gives it.
Estimated Values Look Like Reported Fact
Many private companies don't publish their financial statements. As a result, data providers estimate figures like revenue and headcount instead of reporting them.
Providers such as Dun & Bradstreet attach a reliability label to financial figures, indicating whether a value was reported by the company or estimated by the provider.
An Actual figure comes from the company's own financial statements or filings.
When no actual figure is available, D&B can supply a modeled estimate instead.
It builds these by grouping companies with similar characteristics, such as industry, legal form, business age, and employee count, and using the patterns in each group to estimate figures for companies that don't disclose them.
That makes a modeled revenue figure a statement about companies like this one, not about this company.
If your pipeline drops these labels, a modeled figure and an actual one look identical.
Once both sit in the same numeric field, the model weights them the same way.
To avoid this, keep the provider's reliability label on every field at ingestion, along with any confidence indicator the provider supplies, and feed that label into the model as its own input, the same way you'd feed in a field's age.
Entity Changes Break Financial Histories
One business becomes two records when a rename reaches your API as a new company.
A pipeline that matches one company's name doesn't recognize the renamed business as the same one.
This rename could be a reorganization, change of legal form, or an acquisition or merger that gives the business a new name or a new registration.
However, the case may be that the provider files the results under a fresh identifier.
For acquisitions and mergers, the data is attached to the wrong company.
When a parent consolidates a subsidiary, the subsidiary's results appear inside the parent's reported figures.
A record matched to the subsidiary's name returns the parent's revenue, and a record matched to the parent omits the operations it absorbed.
A reorganization that moves operations into a newly formed subsidiary does the reverse.
The business ends up in a new legal entity with none of the history that belongs to it.
In both cases, the figures look complete, but the mismatch is in whose figures they are.
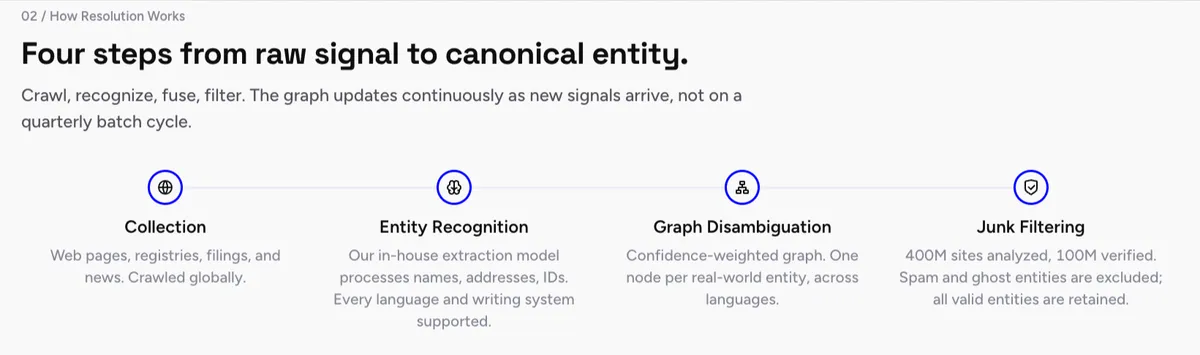
Veridion's Entity Resolution service handles this identity layer.
It matches records that describe one business under different names and maps the ownership links between related entities, making financial figures attached to the right company.
Source: Veridion
It also works alongside a financial-statements API and does not replace one, because it settles which company a set of figures belongs to and leaves the figures to their original source.
A structured-finance rating agency shows the mechanism at work in this Veridion case study.
Many names on its input list were securitization trusts and special-purpose vehicles rather than operating companies, so standard matching either failed to resolve them or matched them to the wrong entity.
Veridion resolved each deal to the entities behind it and classified about 13 role types per structure.
It enriched each entity with:
- 62 firmographic attributes
- Across 21 countries and
- 327 NAICS codes
Then checked every mapping against SEC filings and rating-agency reports.
In a private-equity-owned auto securitization with no single ultimate parent, the mapping separated the funds that own the originator from the manager that administers them and the sub-adviser that owns nothing.
It also flagged, for each deal, the one public company whose disclosures the agency could actually pull data from, since the SPV itself discloses nothing.
The same step tells your pipeline which record's financials belong to a business that has changed shape.
Once every record sits on the correct entity with its ownership dates attached, the open question is whether the numbers on it still match what that business does today.
Financial Data Lacks Operational Context
Financial statements have no field for what a company sells now, where it sells it, or how many people it employs.
Those facts sit outside the statement, yet they can tell you whether a delayed, estimated, or partial financial record still describes the business you are about to lend to.
Sometimes, those facts are hard to keep current.
Statistical offices in Austria, Finland, Hesse, the Netherlands, and Sweden run a joint project to improve national business registers, the databases that hold information such as each enterprise's size, location, economic activity, and ownership relationships.
Their method uses company websites and related online material to check whether the economic activity recorded for an enterprise matches what it describes online.
The automated step flags likely NACE misclassifications, then sends the top three candidate codes to human editors for the final decision.
Statistics Austria has also tested hierarchical models that predict NACE levels down to the fourth digit.
The project reports that the misclassification method works better for codes covering homogeneous activities, making companies with several lines of business harder cases.
The source itself is not available for every company, either.
Eurostat's 2025 survey shows that 79.02% of EU enterprises reported having a website, ranging from 76.67% among small enterprises to 95.65% among large ones.
The survey only covers businesses with 10 or more employees, so among micro-businesses the share is likely lower still.
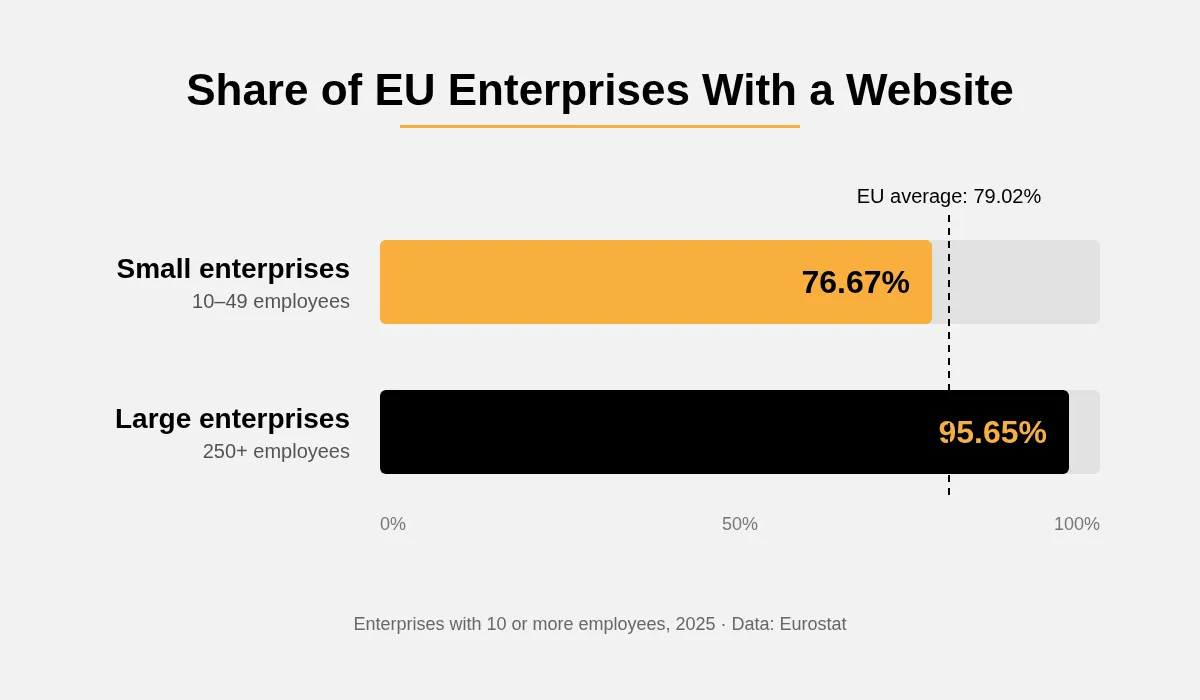
That makes website data useful for enrichment, but incomplete because even when a website exists, the information on it still needs to be interpreted before you can use it as structured company data.
The website carries product catalogues, descriptions of goods and services, ordering information, and locations.
One practical check is to compare the activity the company describes with the industry code already attached to its record.
Mixed businesses in this case need a separate rule.
This project works better for homogeneous activities; enterprises with multiple activities create harder classification cases.
That means a website alone cannot always tell you which activity should become the company's principal classification.
When several activities appear, flag the company as multi-activity and retain the candidate codes until another source, such as a filing or information supplied by the borrower, can establish which activity is economically dominant.
Finally, store the resolved code with its source, the date the website text was collected, and the model or analyst that made the decision.
That gives the industry field the same provenance and freshness controls applied to financial fields.
Conclusion
Private-company financial data becomes difficult to use when the number survives the pipeline, but its context does not.
None of these seven problems announces itself until the company behind it defaults.
For credit, underwriting, and risk teams, closing these risks starts before the data reaches a model.
Tagging when a figure is true, who reported it, and under which standard and entity is what turns a private company's financial data from a source of risk to one you can stand behind.
Articles
Discuss how these trends affect your organization.
Our analysts are available for a short call. Bring a specific question and we will ground it in the data.
Insights
Keep reading
More analysis, research, and outcomes grounded in live company intelligence.
How to Integrate a Company Financial Data API into Credit Risk Models
Connecting a company financial data API to a credit risk model takes entity matching, period alignment and point-in-time snapshots.
6 Mistakes to Avoid when Gathering Market Intelligence
Think your market intelligence is on point? Check out these five frequent mistakes and how to avoid them before it’s too late.
5 Trends Shaping the Future of Market Intelligence
Want to future-proof your business strategy? Explore the top trends defining the future of market intelligence.