Insights / Articles
5 Firmographic Data Accuracy Problems That Silently Kill Your Pipeline
In this article, you will learn five firmographic data accuracy problems that can weaken your pipeline and lead to poor targeting and prioritization.

- Private-company revenue figures can be estimates rather than verified financial results.
- Industry classification is often subjective and inconsistent between providers.
- Headcount data can become stale quickly as companies grow, restructure, or downsize.
- Relying on a single data provider can leave hidden gaps in your market coverage.
Your pipeline isn’t lying to you.
It’s just wrong in ways nobody’s checking.
Consider a lead scored against outdated revenue, a territory sized off a stale headcount number, or a segment built on an industry tag two providers can’t agree on.
None of that shows up as an error.
It shows up as underperformance you end up blaming your reps, your messaging, or your ideal customer profile (ICP).
The data itself rarely gets questioned because it looks complete, confident, and current.
The problem is that it often isn't.
Here are five ways firmographic data quietly breaks down, and what you can do about them.
Revenue Estimation Errors for Private Companies
Revenue looks like a straightforward firmographic field: put companies into revenue bands, prioritize the accounts that fit your ICP, and size your addressable market.
The problem is that revenue doesn’t have the same evidentiary basis for every company.
Public companies generally provide a direct reference point through regulatory filings. Private companies usually don't.
The U.S. Securities and Exchange Commission (SEC) explains that companies that aren’t required to file substantive disclosures may have limited publicly available information, making reliable financial data harder to obtain.

For a private company, a B2B data provider therefore has to infer revenue from indirect signals, such as company websites, business registries, hiring activity, technology usage, web presence, financial databases, or other observable characteristics.
The result is an estimate, not necessarily a verified financial figure.
The problem is that these estimates can be materially wrong. If your ICP starts at $25 million, a company estimated at $40 million may be routed into an enterprise sales motion when it doesn't actually belong there.
An underestimated company can create the opposite problem, falling below the threshold and disappearing from your target account list.
The deeper issue is that revenue accuracy depends on provenance, not just the number itself.
A reported figure, a multi-signal estimate, and a value inferred from a single proxy shouldn't carry the same level of confidence.
Yet once they're stored in your CRM as a single revenue field, that distinction can disappear.
Company structure is another complication.
A provider may attach a parent company's consolidated revenue to a subsidiary, producing a figure that's accurate for the corporate group but wrong for the entity you're targeting.
In other words, the data can be accurate and still be wrong for your use case.
Revenue often drives segmentation, territory planning, lead scoring, account-based marketing (ABM), and total addressable market (TAM) calculations.
When an uncertain figure becomes an input, its uncertainty can propagate into every decision built on it.
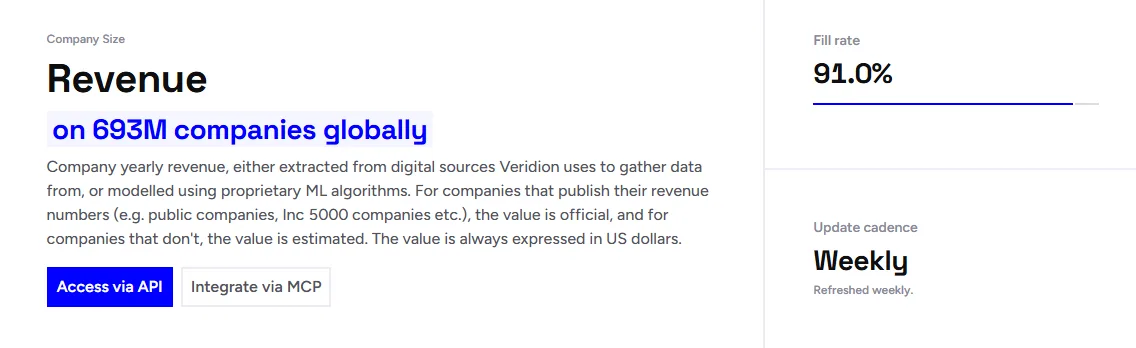
Veridion’s company data distinguishes between extracted and modeled revenue.
When a company discloses financial information, Veridion can use the published figure.
When direct financials aren't available, its AI models revenue from publicly available signals, helping you understand how much weight to place on the estimate.
Source: Veridion
The data also includes confidence information and source context, helping you understand how much weight to place on the figure.
That additional context can be useful when revenue feeds automated firmographic workflows.
If an estimate falls close to an ICP threshold, for example, confidence information can help determine whether the account should move directly into segmentation or scoring or receive additional validation.
Broad, Inconsistent Industry Codes
Industry can be a surprisingly subjective firmographic filter.
Different providers may classify the same company differently because they use different taxonomies, source data, and rules for deciding what a business actually does.
A 2026 study of 6,588 firms illustrates just how much classification accuracy can vary by method.
The researchers compared four automated industry-classification approaches against human-coded ground truth and found accuracy ranging from 26% to 78%, with only fair agreement between methods.
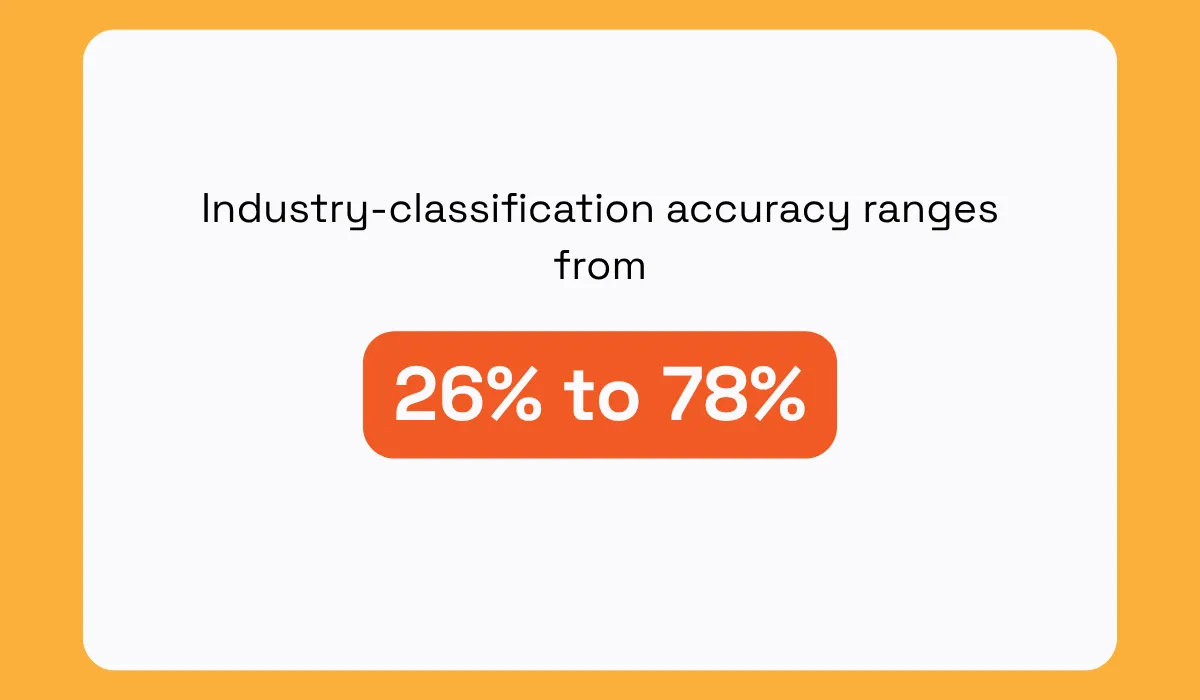
Illustration: Veridion / Data: Sage Journals
They also identified recurring confusion between manufacturing, professional/service, and certain retail/wholesale categories.
Emerging and cross-industry businesses make the problem harder.
Take ‘fintech’, for example.
There’s no universally accepted definition of the term, and the North American Industry Classification System (NAICS) doesn’t have a dedicated fintech code.
A business providing financial services through technology can therefore be classified under several broader categories depending on how its primary activity is interpreted.
That matters when you use industry as a hard filter.
If your ICP targets fintech companies but your provider places some of them under “Financial Services,” legitimate prospects can disappear from your search.
A broad “Software” category can create the opposite problem, pulling in companies whose products or business models have little to do with your target market.
These classification errors can flow into ICP segmentation, lead routing, and campaign targeting.
The problem compounds when you combine multiple data sources with different taxonomies: the same company can land in different segments depending on which system supplies the industry field.
The classification method therefore matters as much as the label itself.
Rather than relying solely on a static industry code or a company's self-description, you can classify businesses based on what they actually do.
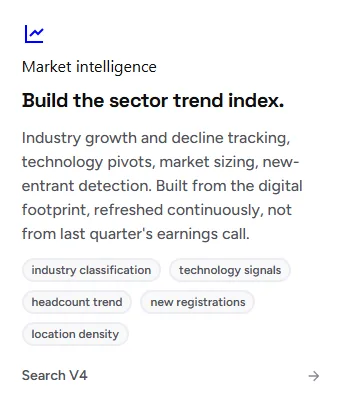
Veridion’s market intelligence solution uses machine-learning models to classify approximately 200 industries and 600 business categories based on real-world activity signals, providing a more granular view of what each business does.
Source: Veridion
For enterprise teams, that distinction can make your segmentation more precise.
Instead of asking only, “What industry code does this company have?” you can ask, “What does this company actually sell, and which business does it serve?”
Stale Headcount Numbers
Headcount is one of the most useful firmographic filters for enterprise targeting.
It can help you identify companies at the right scale, segment accounts by size, assign territories, and prioritize prospects.
The problem is that employee count is frequently changing.
In the U.S. alone, employers recorded 63 million hires and 62.8 million separations in 2025, including 38 million employee-initiated quits and 21.2 million layoffs and discharges.
A headcount figure captured at one point in time can easily become outdated as employees join, leave, or move through restructuring, acquisitions, and divestitures.
That makes freshness part of accuracy.
A company listed as having 500 employees may have had 500 employees when the record was created, but without a verification date, you don't know how current that figure is.
Without consistent data refreshing, you’re effectively treating a historical snapshot as a current fact.
A 2026 case study illustrates how this can become a broader data-quality problem.
One B2B team paying $160,000 a year for company data found that 37% of its records were wrong or missing.
The errors included incorrect headcount and stale revenue figures, while the provider hadn’t updated the affected records in months.
The impact becomes particularly important when headcount defines your ICP.
If you target companies with 500–5,000 employees, stale data can create problems for your internal planning.
A company that has grown beyond your ICP threshold may be overlooked, while a downsized business may continue receiving sales attention intended for a larger organization.
Mergers and acquisitions (M&A) can amplify the problem.
Employees may move between entities or become consolidated under a parent company, meaning a previously accurate headcount can become misleading even when the underlying source hasn't changed.
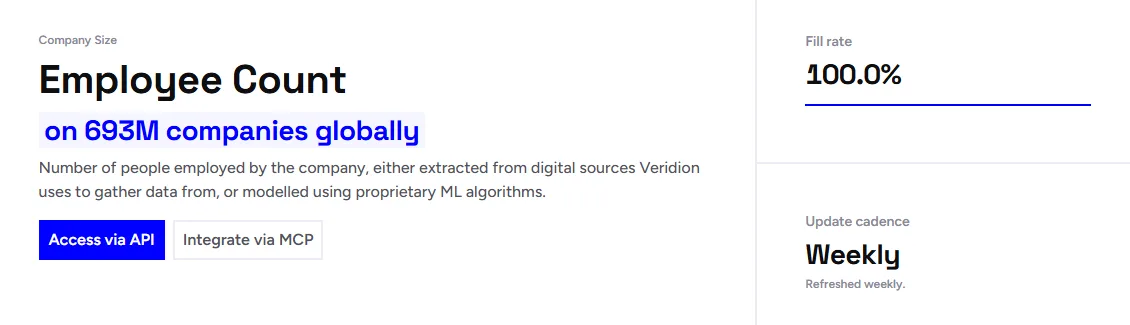
Veridion addresses this freshness problem through a weekly data-refresh cadence.
Its company database is updated weekly, with each profile carrying a Last Updated At field showing the data on which the company’s information was last verified.
For employee count, the dataset also distinguishes between extracted and AI-modeled values, giving you additional context about the figure itself.
Source: Veridion
That combination matters because a headcount number without a timestamp tells you what the value is, but not whether you can trust it today.
With both freshness and data type visible, you can make better decisions about which firmographic records are ready for automated segmentation and which need additional validation.
Single-Source Blind Spots
Even a data provider with broad coverage will have gaps.
Providers collect information from different sources, have different geographic strengths, and use different methods to verify or model company attributes.
That makes single-source dependency a hidden data quality risk.
If your CRM, enrichment workflows, and segmentation logic all rely on one provider, you don’t just inherit its strengths.
You also inherit its blind spots.
Jonathan Maurin, Founder & CEO of Derrick, a B2B data-enrichment platform, illustrates the trade-off between coverage and accuracy:
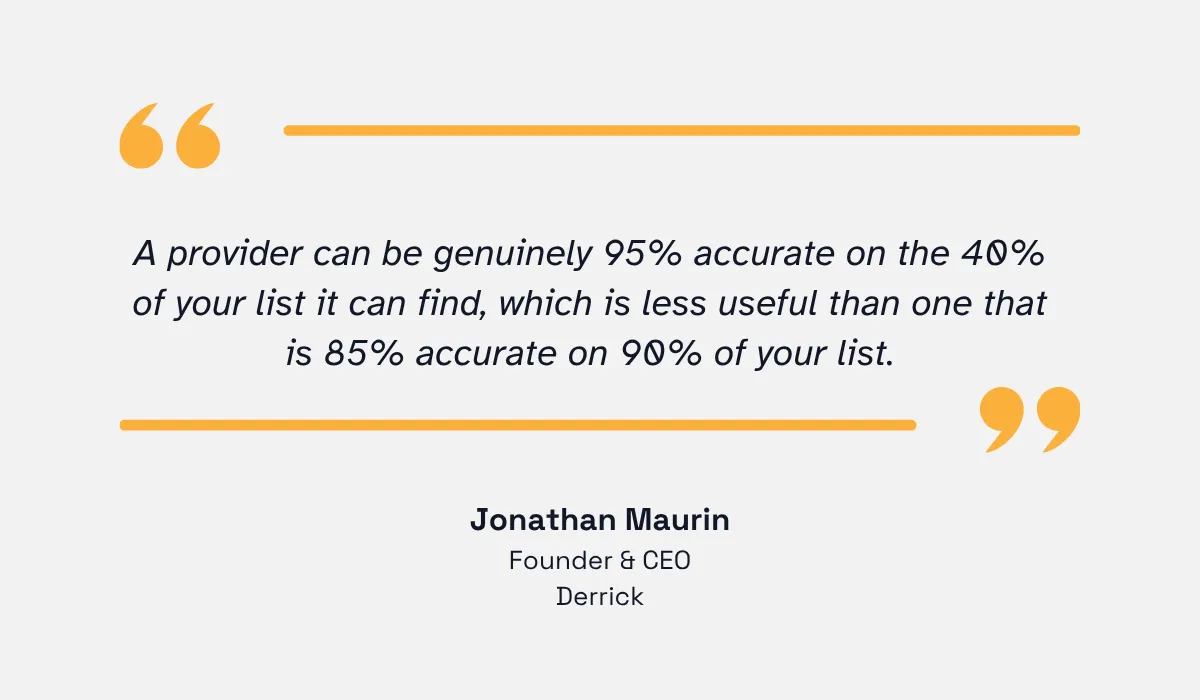
Illustration: Veridion / Quote: Derrick App
One common response is waterfall enrichment, which sends a record through multiple data providers in sequence when the first source cannot return a sufficiently complete or confident result.
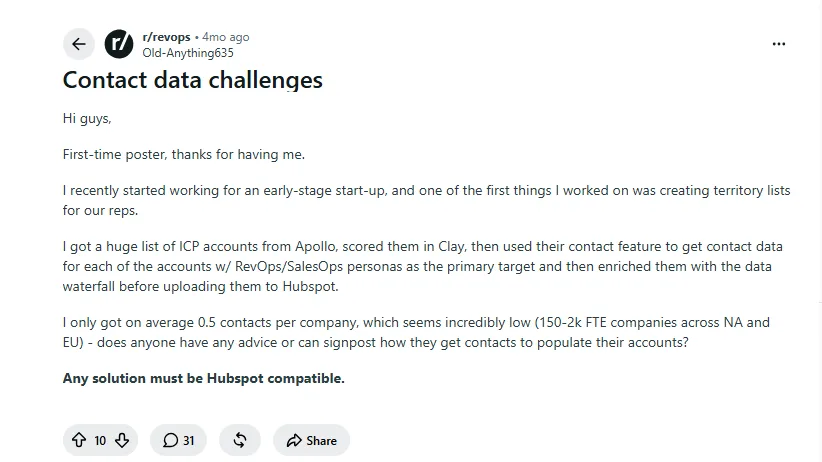
RevOps practitioners report encountering coverage gaps that vary by geography and company segment, prompting some teams to layer multiple providers rather than rely on a single database.
Source: Reddit
A provider may have strong coverage in one market or for one attribute but weaker data elsewhere, leaving enterprise teams with missed prospects or incomplete profiles.
Corporate hierarchies create an especially important blind spot in firmographic data.
A global company may consist of a parent corporation, subsidiaries, regional entities, divisions, and operating companies, but databases don’t always distinguish those entities correctly.
A subsidiary’s employees or revenue can be attributed to the parent company, while a global figure can be applied to a local operating entity.
The resulting data can be accurate at the corporate group level but wrong for the entity your sales team is targeting.
Imagine you’re targeting companies with 1,000–10,000 employees in a specific country.
If your database assigns the parent company’s 50,000 global employees to a local subsidiary with 800 employees, that account could incorrectly qualify for your ICP.
The opposite can happen, too: a subsidiary that genuinely meets your criteria may be excluded because its data is buried under the parent record.
These aren’t merely database cleaning issues.
Firmographic fields can feed account segmentation, territory design, routing, TAM calculations, and ABM campaigns.
When a provider’s blind spot becomes a CRM value, that gap can propagate into every workflow built on top of it.
The answer isn’t necessarily to maintain five databases and reconcile them manually.
It's to understand where your data source is strongest, where critical gaps remain, and whether you have a reliable way to validate or fill them.
The goal isn’t to eliminate every source of uncertainty, but to make sure one provider’s blind spot doesn’t silently become your pipeline’s blind spot.
Missing SMBs
Firmographic data often looks more complete at the top of the market than it does in the long tail.
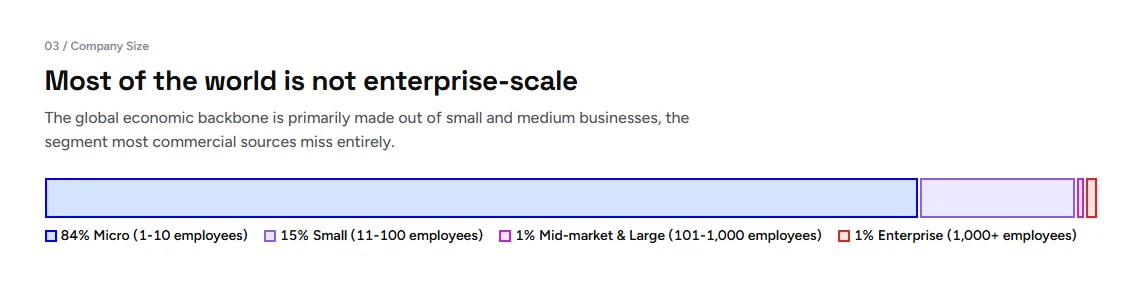
Large enterprises tend to generate more public signals, such as corporate websites, regulatory filings, press coverage, hiring activity, business registrations, and financial disclosures.
Smaller private companies generate fewer of those signals, and is even more pronounced in markets where formal business records are less comprehensive.
The challenge isn’t simply that SMBs have less of a digital presence.
They can be active online while remaining difficult to capture through conventional company records.
In a 2023 UNDP survey of 1,013 micro and small businesses across 13 Global South countries, more than 60% were unregistered, even though more than 80% used digital tools such as Facebook and WhatsApp.
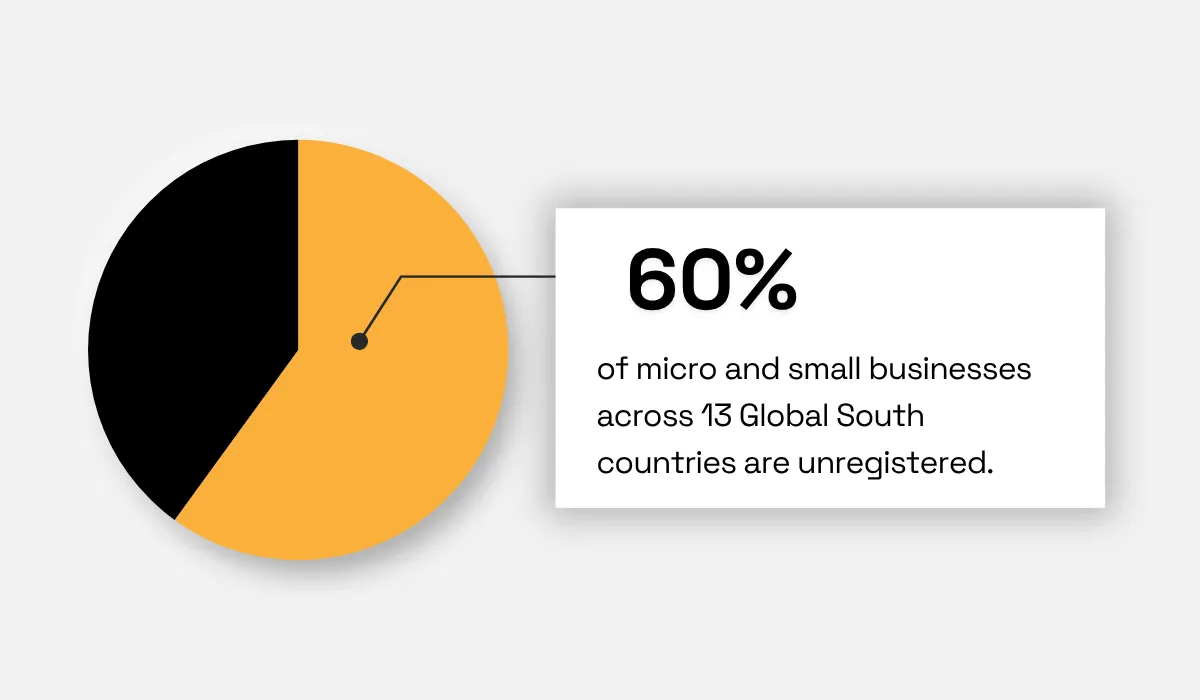
That illustrates how digital visibility doesn't necessarily translate into inclusion in the formal records that traditional business databases rely on.
The geographic dimension makes this harder.
Business registries, naming conventions, corporate structures, and publicly available information vary between countries.
A provider with deep coverage in the U.S. and Western Europe may therefore struggle to build equally complete profiles for smaller businesses in other markets.
This creates a different kind of data-quality problem from inaccurate records.
An incorrect record can be corrected. A company that never enters your database can't be scored, segmented, routed, or included in your TAM.
The consequences can compound when you use firmographic data to build an ICP.
Suppose you score potential accounts using company size, industry, geography, and revenue.
If your database systematically underrepresents smaller companies in certain countries, your model may conclude that those markets contain fewer viable prospects than they actually do.
The resulting TAM isn’t merely incomplete. It can be systematically biased toward the companies your data provider finds easiest to identify.
This matters particularly when you sell to SMBs or use SMB-heavy markets as part of your expansion strategy.
Even a highly accurate scoring model can produce misleading results when it's applied to an incomplete population.
Coverage is therefore part of model accuracy.
Veridion takes a broad-coverage approach to this problem.
Its database contains 693M companies globally, including private businesses and SMBs that can be harder to capture through traditional sources.
Source: Veridion
The data is refreshed weekly, helping ensure company profiles don't remain static for long periods.
For enterprise teams, that breadth matters because your addressable market shouldn’t be constrained by which companies happen to be easiest to identify.
If your data systematically misses smaller or less-visible companies, your pipeline can look healthy while your market coverage remains incomplete.
Conclusion
Revenue estimates, industry tags, and headcount figures don’t come with warning labels when they’re wrong.
They just sit in your CRM, get pulled into a scoring model or a territory plan, and quietly steer decisions in the wrong direction.
Individually, they look like a rounding error.
Stacked across thousands of accounts, they add up to a pipeline that’s making decisions on a distorted picture of your actual market.
The only way to catch that distortion is to stop treating firmographic data as a fixed input and start treating it as something you actively verify, refresh, and weight by confidence.
Articles
Discuss how these trends affect your organization.
Our analysts are available for a short call. Bring a specific question and we will ground it in the data.
Insights
Keep reading
More analysis, research, and outcomes grounded in live company intelligence.
The Danger of Stale Data: Mitigating Premium Leakage in Automated Underwriting Systems
Tired of premium leakage in automated underwriting? Discover how decision automation can prevent costly errors caused by stale data.
What is a Match Score? Understanding the Waterfall Methodology in Company Data Enrichment
Tired of inaccurate company data? Understand the data enrichment API match score and fuzzy company name matching with the Waterfall Methodology.
How to Build a Firmographic Lead Scoring Model That Actually Predicts Revenue
Looking to build a firmographic lead scoring model? This guide will show how company data can help prioritize leads and improve revenue predictions.