Insights / Articles
How Credit Rating Agencies Map the Relevant Group Parent and Group Members Before Analysis
Rating agencies map the group parent and members with an entity graph: a full ownership tree, entity types, link confidence and continuous updates.

- Mapping the full legal ownership tree is the basis for every judgment that follows.
- Entity types need to be distinguished, since different entities have different analytical roles.
- Updating the entity graph is essential, as only 51.3% of reported direct parent links are fully corroborated.
A company's legal parent and its analytically relevant group parent are not always the same entity, and rating frameworks have to work out which one actually matters for assessing overall creditworthiness.
That distinction affects every group rating decision, yet it doesn't show up on an org chart.
Before any group methodology can be applied, a data team needs a reliable entity graph that separates the two.
This article shows how that graph is built, verified, and kept current.
Building the Entity Graph
This stage exists to produce an accurate map of who owns what and controls whom.
Analysis about which entities matter to the group is not conducted here.
Even so, having a transparent map of ownership and control ensures that every analyst and investor evaluates the group’s credit profile from a single, consistent baseline.
Next, we’ll cover two practices, both of which describe the entity structure.
Map the Legal Ownership Tree
Analytical relevance cannot be assessed on a structure that has not been mapped completely.
So, the first task is to record every entity above and around the company being analysed, together with every ownership link between them.
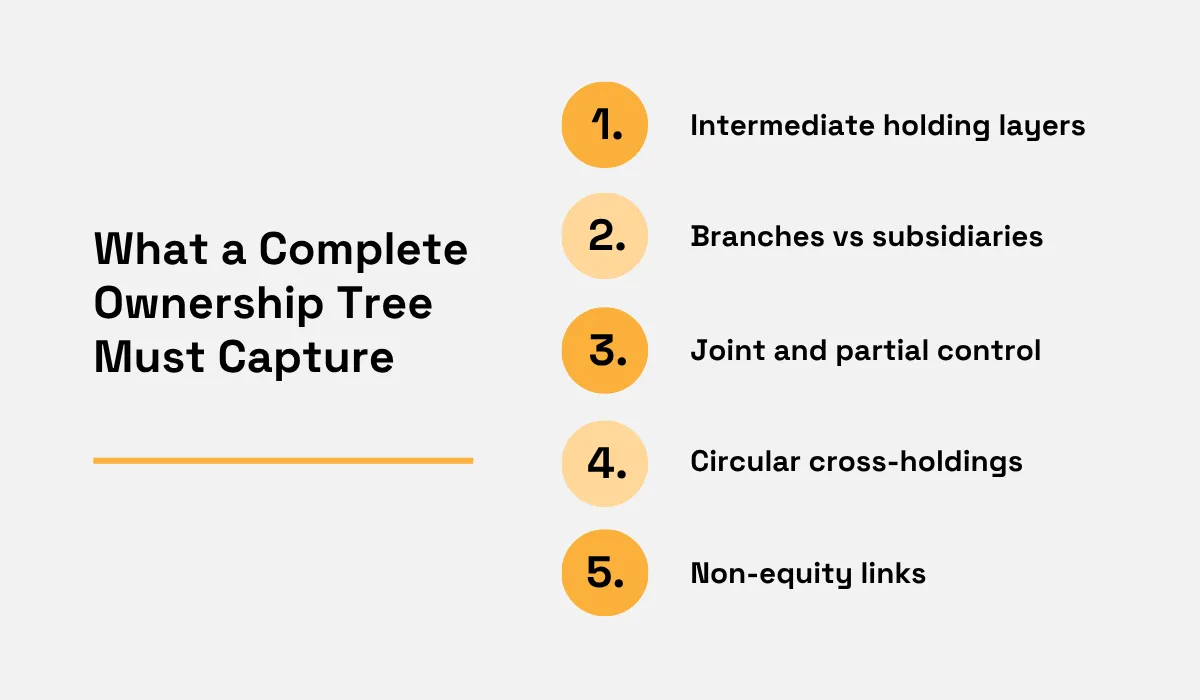
The image below gives a framework for capturing all entity details to ensure that no components are accidentally left out.
Source: Veridion
Each step listed in the image above must be captured, as the mapping only covers relationships that are easiest to find.
A process built around majority-owned subsidiaries, for example, will record the clean parent-to-subsidiary pairs and omit jointly controlled entities or branches registered to a legal entity in another country.
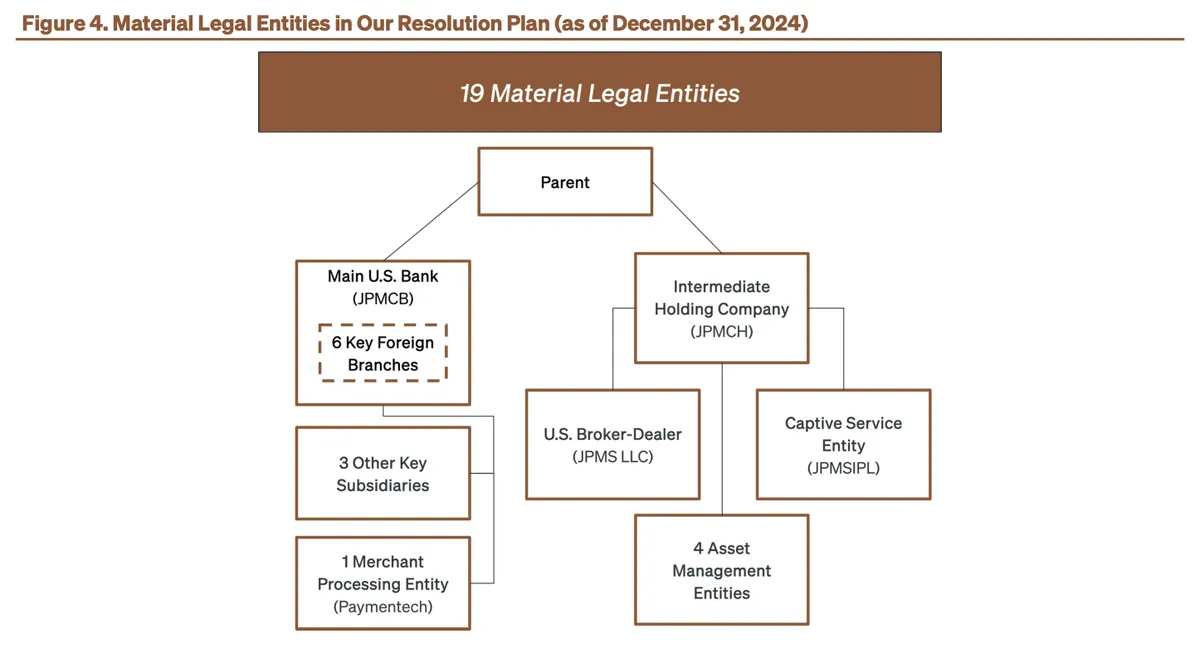
An example of one part of an entity group, showing only the material legal entities, is shown below.
Source: JPMorganChase
This comes from JPMorganChase's 2025 resolution plan, a document some large US banks publish describing how they would be disintegrated in the event of a failure.
It designates 19 material legal entities and divides them into two chains, one under the main US bank and one under an intermediate holding company.
Of course, the entity group of an institution this size would be too large to keep up with internally.
To assist with entity mapping at scale, Veridion is needed.
It is a business data provider for data teams within large enterprises, and its models read the unstructured contents of the web, including registries, filings, company websites and news.
What they find is resolved into structured company records that are refreshed continuously rather than on a fixed schedule.
In addition, Veridion can build the underlying entity and ownership map that this stage produces, resolving ownership links across jurisdictions and naming variations.
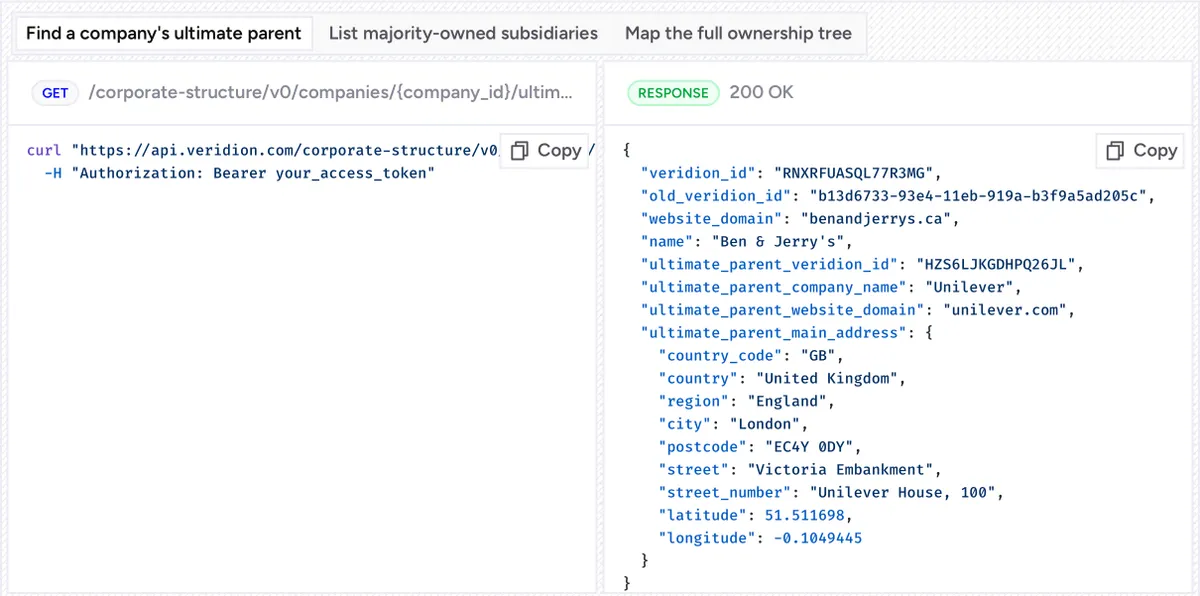
Features like the Corporate Groups API return a company's ultimate parent from a single identifier, as the example below shows.
Source: Veridion
The same set of endpoints will also list majority-owned subsidiaries and map the full ownership tree, with each link labelled by relationship type, such as subsidiary, affiliate or joint venture.
These are enterprise features, delivered through the API or as batch files under a commercial agreement.
The links themselves are built from legal filings combined with digital footprints across many sources, which matters when a subsidiary appears in a registry under one name and a different name on its own website.
As a result, a data team starts from a resolved structure instead of assembling it manually from separate registry extracts.
Distinguish Entity Types Within the Tree
Not every node in the ownership tree plays the same analytical role.
Before the group can be assessed, the entity types have to be separated from one another.
Consider what S&P Global Ratings writes in its Group Rating Methodology: the criteria it applies when a company belongs to a wider group.
They explain that the entity a group analysis centres on is identified through control and relevance, not through position in the ownership chart.
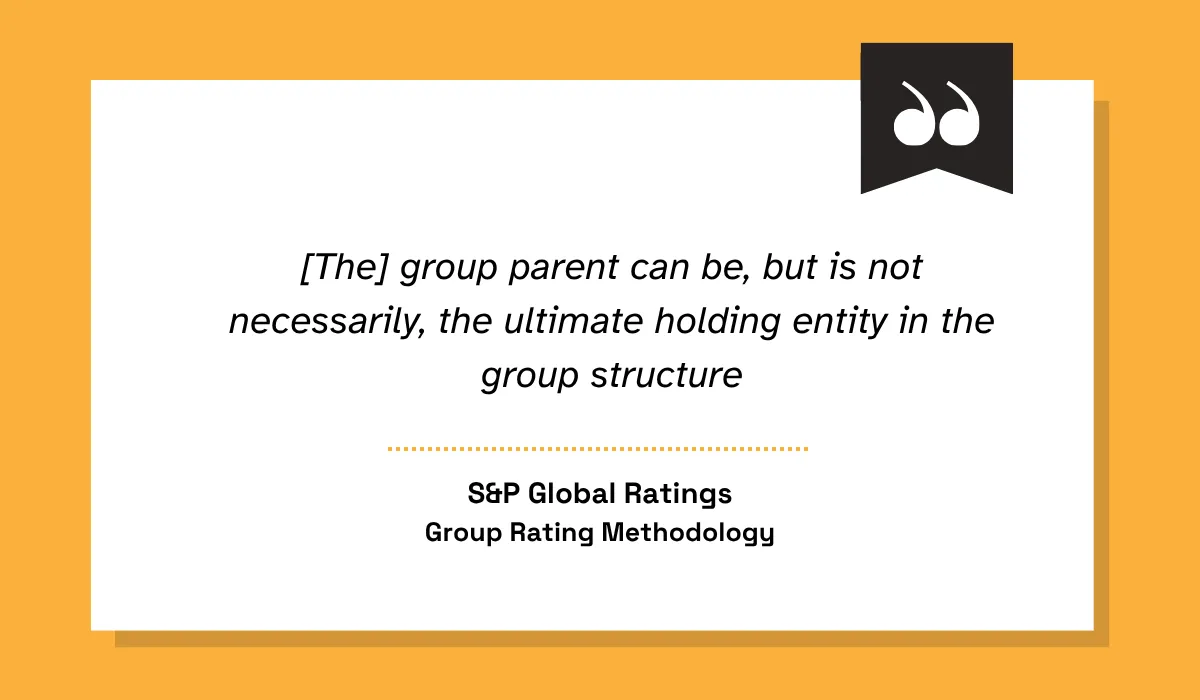
What they mean is that several holding companies can exist above the entity in review.
These holding companies could be created for tax treatment or regulatory reasons, and as such,be excluded from the analysis when they have no material liabilities or operating assets.
Distinguishing the types means recording what each entity does rather than only where it appears.
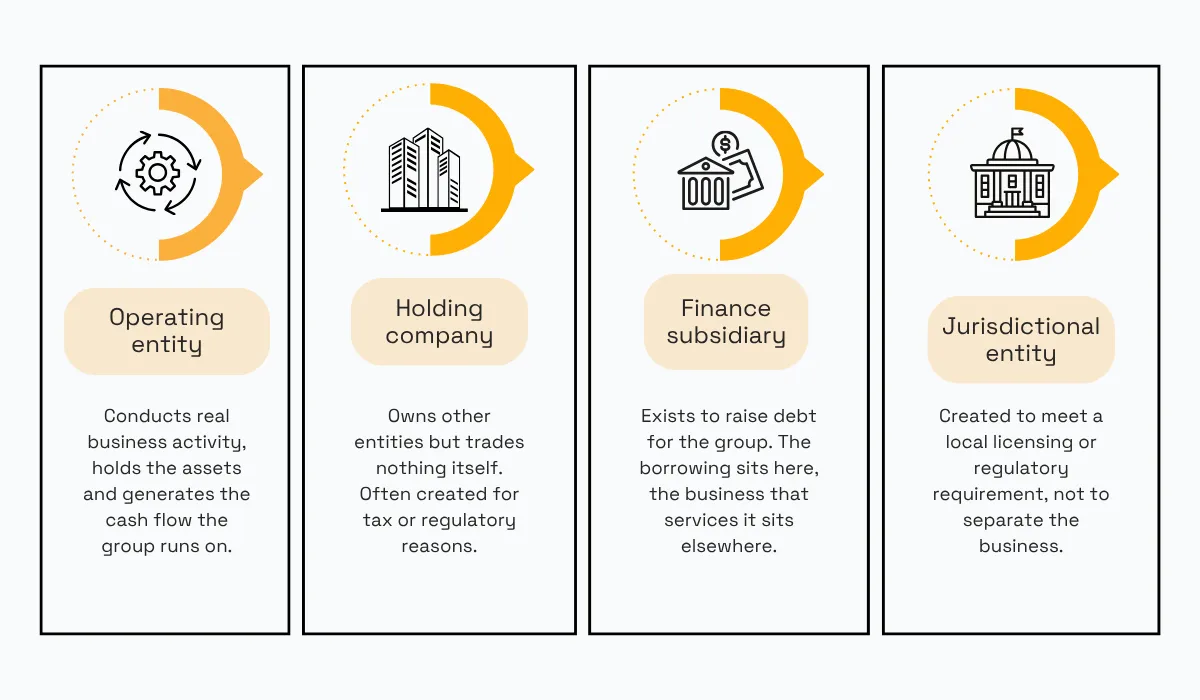
Some of the main entity types to distinguish are shown below.
Source: Veridion
As the short explanations show, each type exists for a different purpose, which is analytically relevant.
To illustrate, consider an operating entity, let’s call it Company A, next to a finance subsidiary, ‘Bank B’.
Company A generates cash flow to service group debt, while Bank B raises the debt and lends the proceeds internally.
Treating the two as equal produces a distorted picture, because the borrowing is recorded at one node and the ability to repay it exists at another.
This distinction becomes clearer with a real example.
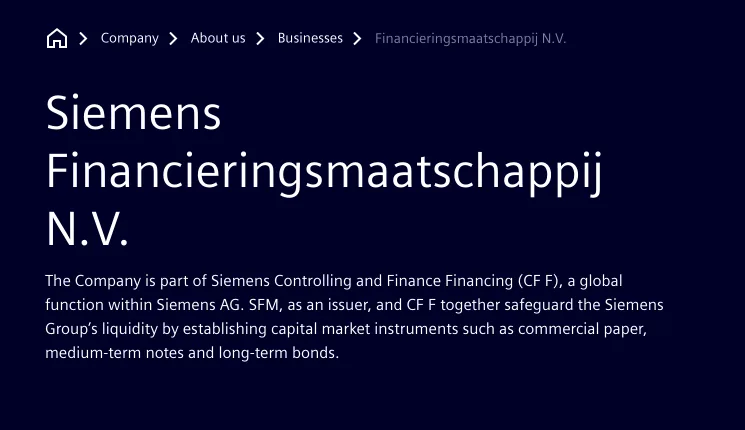
One such entity is Siemens Financieringsmaatschappij N.V., which has no operating business of its own.
Source: Siemens
Its stated role is to establish capital market instruments for the Siemens group, including commercial paper, medium-term notes, and long-term bonds.
A graph that records only the ownership link would show a Dutch subsidiary near the bottom of the structure.
What the entity does is raise money on the capital markets for the group as a whole, which makes it a different kind of node from the operating businesses around it.
Entity type therefore changes what a node means, even when the ownership link above it has been recorded correctly.
Keeping the Graph Trustworthy and Current
An entity graph built once and never revisited becomes a liability, rather than an asset, when the structure it describes stops matching the structure that exists.
Two mechanics prevent that, and both of them are ongoing work rather than one-time steps.
Assign Relationship Confidence
An ownership graph presents each link in the same way, whatever the evidence behind it.
Not every ownership or control relationship in the graph is equally certain or equally clear.
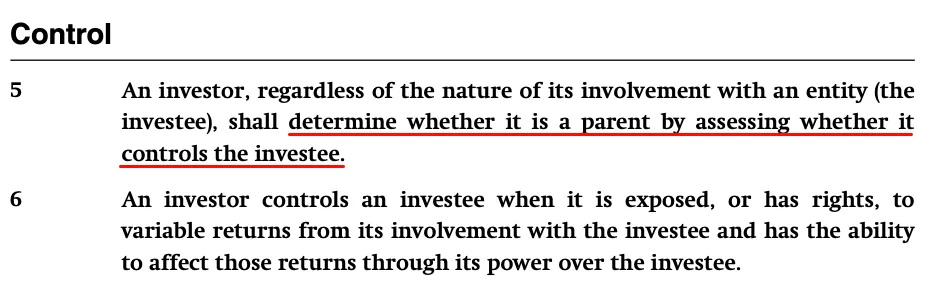
For instance, when it comes to entity control, the International Financial Reporting Standards (IFRS) set out guidelines on when one company is the parent of another.
An excerpt is shown below.
Source: IFRS
Control defined this way is not directly obvious from an ownership percentage.
A shareholder below 50% can direct the activities that affect returns through convertible instruments or board rights, while a majority shareholder can be prevented from doing so by an agreement with other investors.
What makes this more complicated is that the ownership graph itself needs to be verified, link by link.
According to data published by the Global Legal Entity Identifier Foundation (GLEIF), custodians of the global register of legal entity identifiers, most reported parent relationships have not been independently confirmed.
The validation status of the direct parent relationships in that register, from its business report for the first quarter of 2026, is shown below.
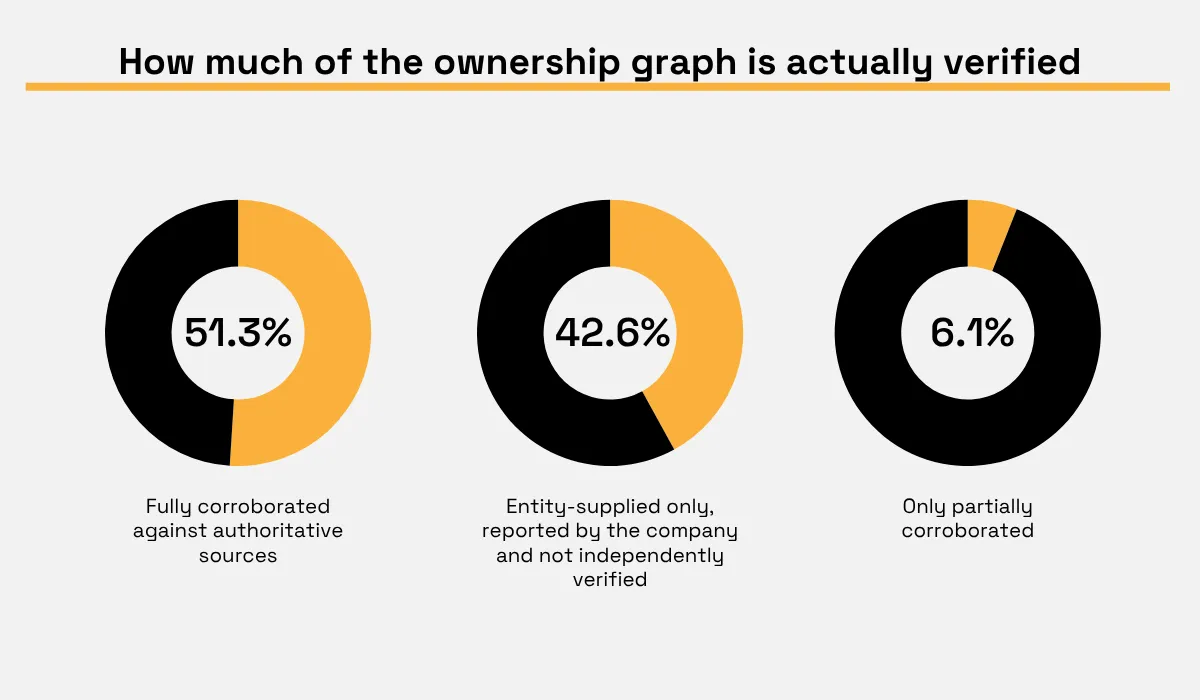
Entity-supplied data means the company reported the relationship about itself and has not been verified by an authoritative source.
Thus, the link may not be wrong, but it does depend on only one interested party and nothing else.
For that reason, it's a good idea to follow enrichment practices that combine several independent sources, and to store a confidence value with each link rather than a flag.
Determining relationships with a confidence level matters because ownership alone can be misleading about how much control it delivers.
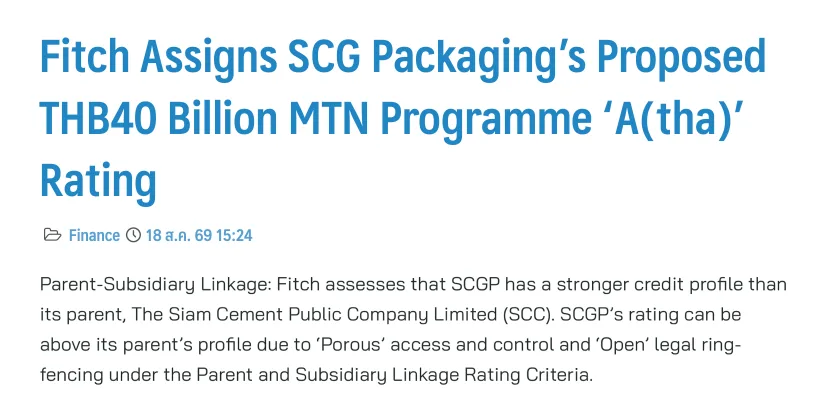
A rating action published in August 2026 shows what that looks like in practice.
Source: ThaiPR
Here, the ownership link is not in question.
What varies is how much control that ownership delivers, and Fitch graded it as porous, with legal ring-fencing assessed as open.
Because of those assessments, the subsidiary could be rated above the consolidated profile of its parent.
A graph recording only the ownership percentage would not accurately show the real reasons for the difference in rating.
Confidence, therefore, belongs in the data model itself, not in the notes of whoever built it.
Track Current Ownership State and Group Changes
Even when ownership relationships are mapped with confidence, group structures are not static.
Changes happen constantly, and tracking them is essential if the graph is to describe the group as it exists today rather than its status at onboarding.
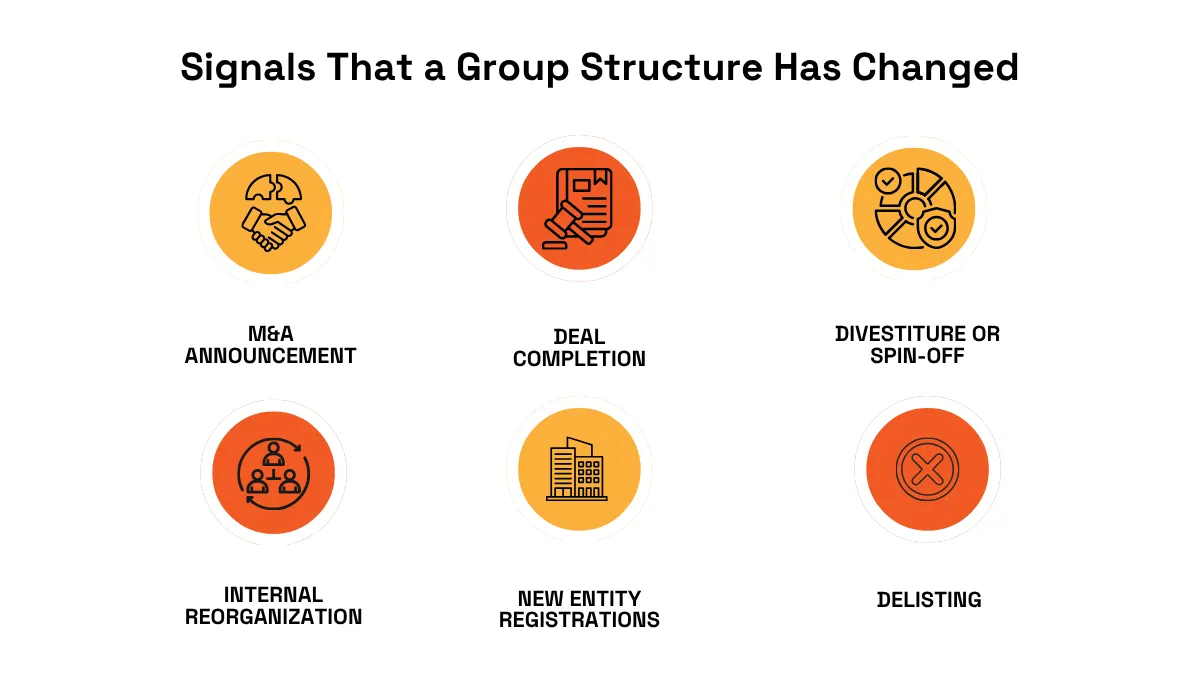
Several signals may indicate change in structure, and some of them are shown below.
Source: Veridion
For instance, a mergers and acquisitions (M&A) announcement signals that the structure is going to change, though nothing has changed yet.
So, an entity graph should record the announcement without rewriting the ownership link.
Or, consider a new entity registration connected to an existing group member, sharing an address, directors, or a name stem, which can indicate an internal reorganisation that never appears in the press.
Sometimes these group structure changes are clear, as in the case of a large acquisition announced and completed in public.
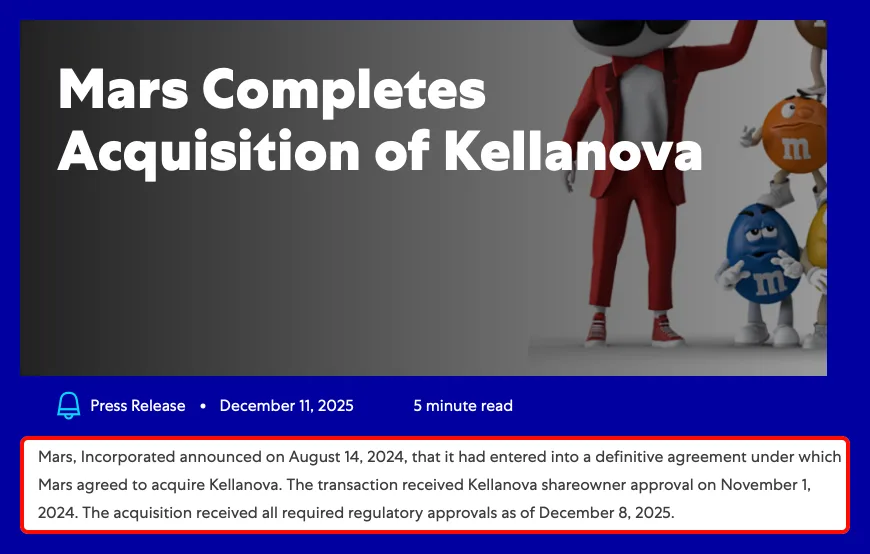
This was evident when Mars completed its purchase of Kellanova in December 2025.
Source: Mars
Nearly sixteen months passed between the announcement in August 2024 and the completion, with shareowner approval in November 2024 and the last regulatory clearance arriving days before the deal closed.
Updates are necessary throughout that period rather than at the end of it.
A graph updated on announcement would have recorded the wrong parent for over a year, while a graph updated only at annual review might have recorded it for longer.
Here, artificial intelligence is useful for tracking the disclosures where these changes first appear.
Zornitsa Manolova, Head of Data Quality Management and Data Science at GLEIF, writes for Finextra about how ownership information is extracted from corporate disclosures.
Among other things, she describes those documents as “challenging to integrate”.
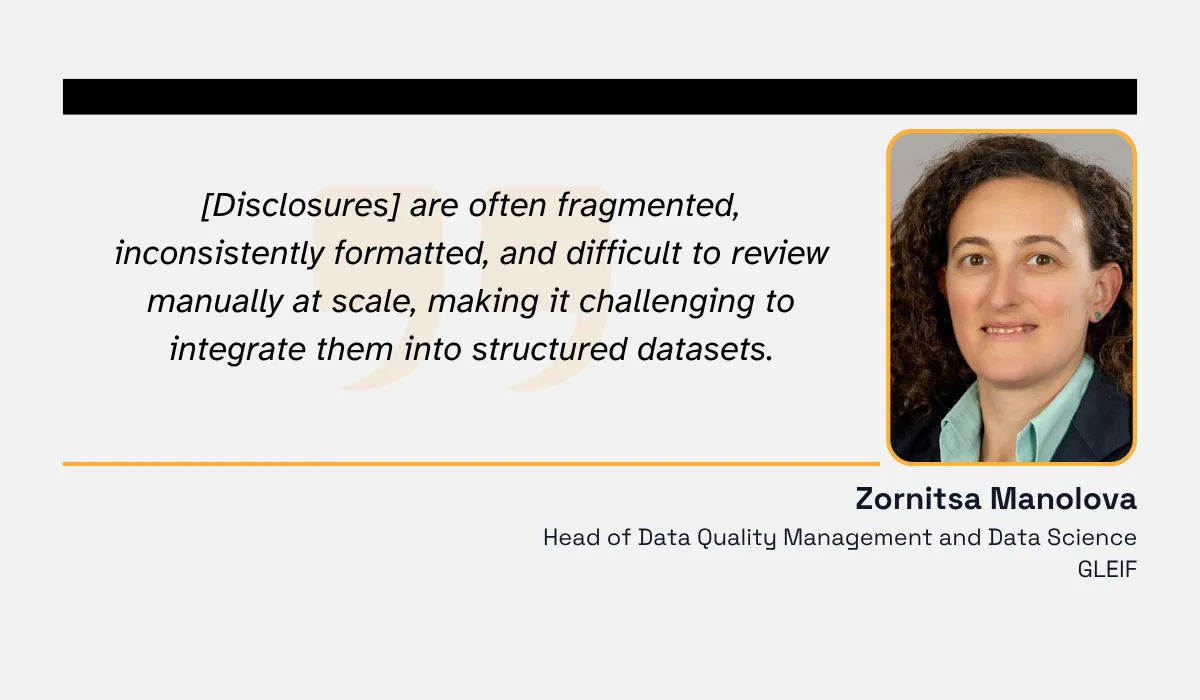
Manolova explains that extraction models can read those disclosures and either confirm an existing relationship record or trigger an update. This allows relationship data to be corrected between annual renewal cycles instead of only during them.
Data teams need systems that record changes as they occur, rather than working from whatever structure was mapped at initial onboarding.
Keeping the graph current is continuous work rather than a project with an end date.
Where the Entity Graph Ends, and Group Methodology Begins
Once the entity graph is built, verified, and current, it becomes an input into group rating methodology.
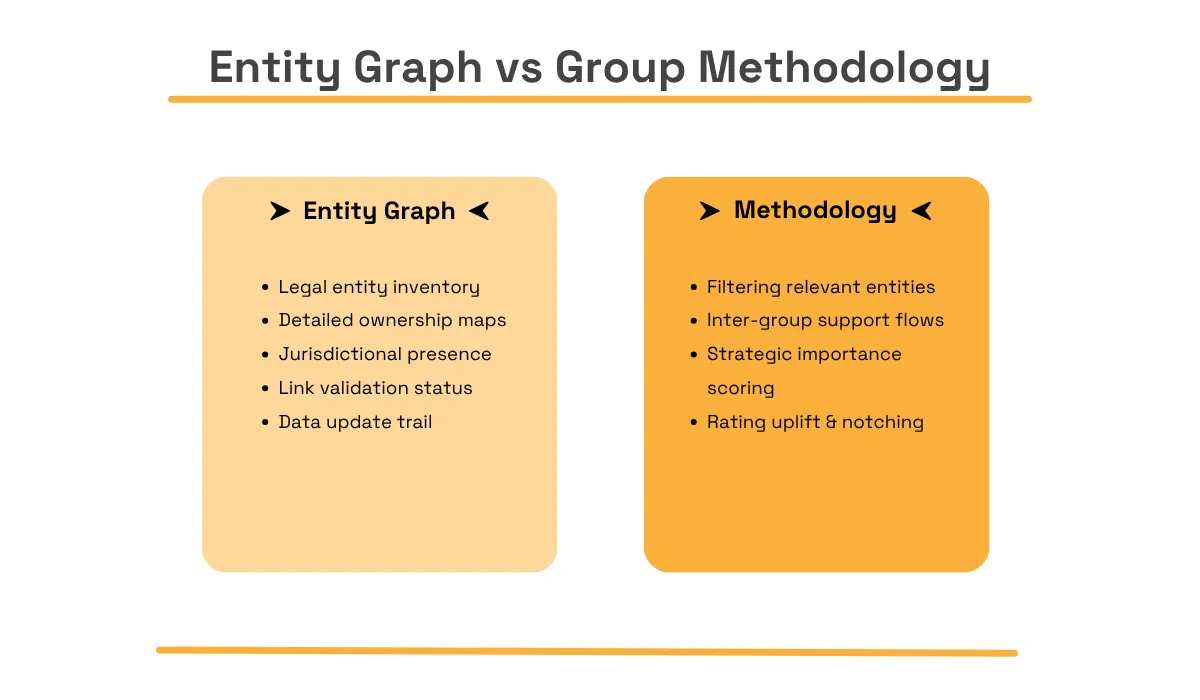
The graph itself does not decide which entities are analytically relevant to the group, how support flows between them, or what rating uplift or notching applies.
Those are methodological judgments made by the analyst and the rating framework, using the graph as a foundation rather than a substitute for that judgment.
Only after the structure has been described accurately can the work move to that next step.
Group rating methodology is the set of criteria an agency applies to decide group membership, the group credit profile, and the status of each member within it.
As the illustration below shows, different work belongs to each.
Source: Veridion
A graph does not inform analytic decisions on its own.
For instance, it can record that one entity owns another and the percentage involved, but it cannot state whether the parent would supply liquidity to that subsidiary under stress.
Or consider notching, where the graph records jurisdictional presence and link validation status, while the methodology converts those facts into a rating placed above or below the group profile.
It's worth noting that the same graph can produce different conclusions in different hands.
As the European Banking Authority (EBA), issuers of guidelines for banks across the European Union, explains in its guidelines on connected clients, analysis of the same entities does not always produce the same grouping.
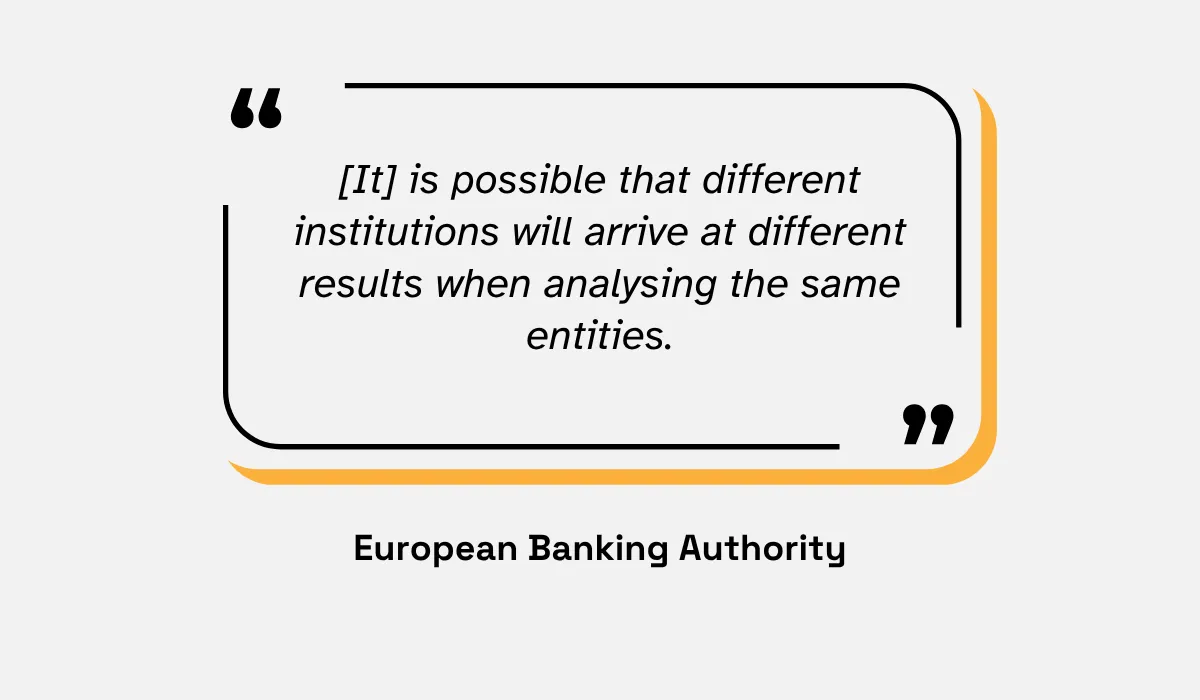
These differences happen because the judgment involves evidence that cannot be automated, including economic dependencies that only appear case by case.
The graph therefore does not remove the judgment, but it does make the judgment defensible by recording what was known, from which source, and when.
The two stages remain separate, with description on one side and interpretation on the other.
Conclusion
A group rating is only as reliable as the entity graph underneath it. Mistakes in the ownership tree, the entity types, the confidence levels or the currency of the data cannot be corrected by methodological rigour applied afterwards.
Treat the graph as continuous work and the judgments built on it will be worth trusting.
Articles
Discuss how these trends affect your organization.
Our analysts are available for a short call. Bring a specific question and we will ground it in the data.
Insights
Keep reading
More analysis, research, and outcomes grounded in live company intelligence.
A Closer Look at the Top B2B Data Enrichment Companies Businesses Rely On
Struggling to find reliable firmographic data providers? Uncover the top B2B data enrichment companies that businesses trust to fuel growth.
Best Practices for Data Enrichment
Learn how data enrichment best practices help businesses turn raw data into accurate and actionable insights.
How to Build a Strong Market Intelligence Strategy
Learn how to build a strong market intelligence strategy that helps you track trends, understand competitors, and make smarter decisions.