Insights / Articles
Is Your Territory Plan Fair? How Firmographic Balancing Fixes Rep Inequality
Tired of unequal sales territories? Firmographic balancing can fix rep inequality. Discover how firmographic data providers help create fair plans.

- 35% annual sales turnover makes territory inequality expensive.
- 56% of territories were found to be incorrectly sized.
- Fair territories balance opportunity, workload, quota, and account fit.
What if your sales reps are not failing because they lack skill, but because their territories are working against them?
A territory can look balanced by account count and still give one rep far more revenue potential than another.
Over time, that discrepancy can hurt quota attainment, earnings, morale, and retention. The problem becomes even more costly when experienced reps leave and take customer knowledge with them.
This is why territory planning needs to go beyond dividing accounts evenly.
The Problem with Territory Inequality and the Consequent Rep Attrition
Two territories can have the same quota but very different chances of reaching it.
One rep may inherit a strong customer base and steady demand, while another has fewer accounts, weaker opportunities, or a market that is harder to sell into. The result is an uneven workload and a greater risk of reps missing quota for reasons they cannot control.
And that matters because poor territory design can contribute to rep frustration and attrition. When reps repeatedly struggle to hit targets despite putting in similar effort, they may start looking for better opportunities elsewhere.
Turnover Rates Reveal the Real Cost
Sales turnover is expensive. But are you looking at the cost of losing a rep, or only the cost of hiring their replacement?
The Bridge Group’s 2015 SaaS Sales Compensation & Metrics Report, based on 342 B2B SaaS companies, found that 34% of sales reps left their roles each year, excluding internal promotions.
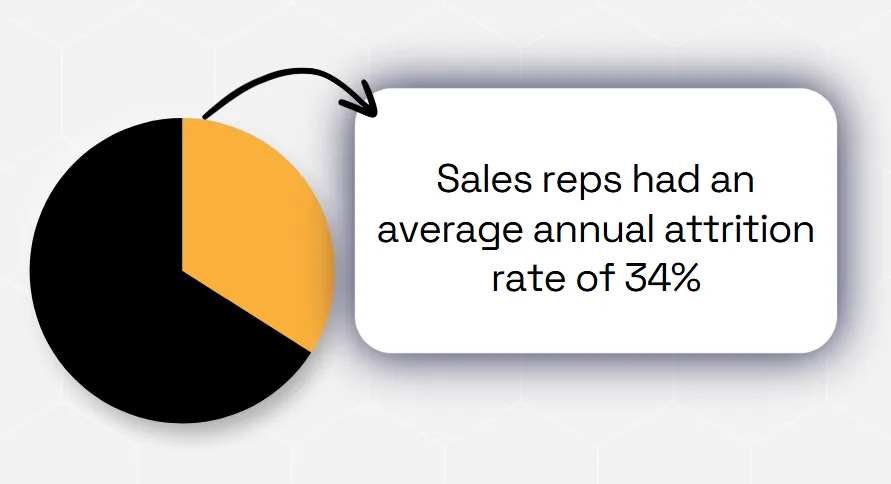
Illustration: Veridion / Data: forEntrepreneurs
That difference can add up quickly over a couple of years, especially for teams that depend heavily on experienced reps.
Zyverno, a hiring intelligence firm, estimated that replacing one sales rep can cost an average of $215,500–$292,000 when the full impact of the departure is considered.
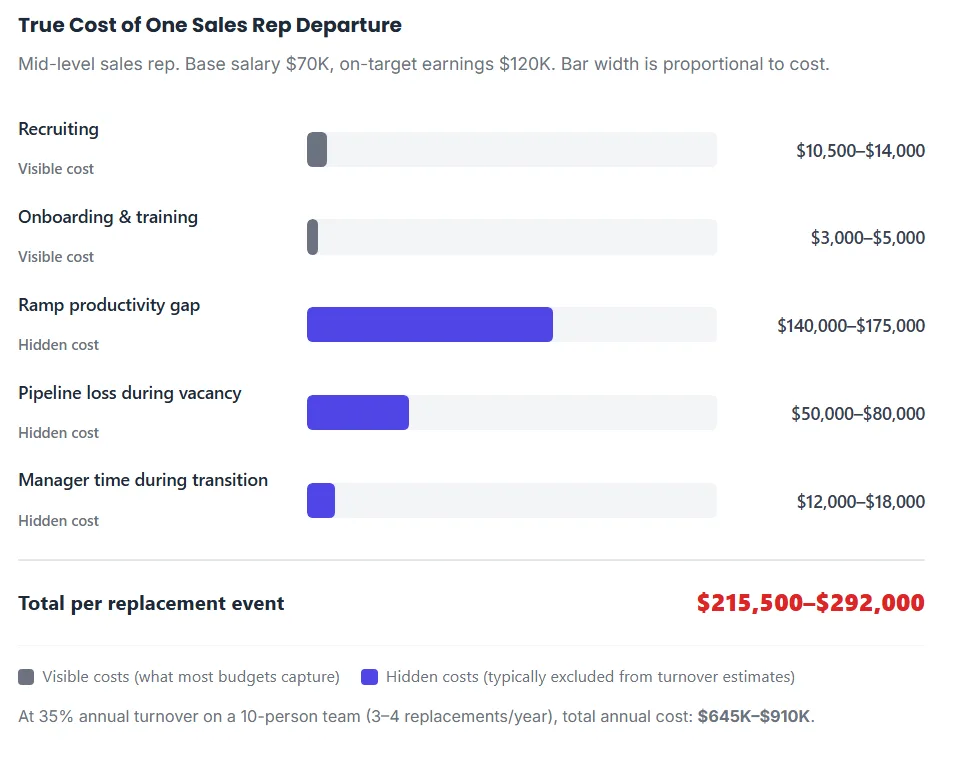
Source: Zyverno
For a 15-person sales team, a 35% turnover rate means roughly five reps could leave in a year. At Zyverno’s estimate, replacing them could cost $1.1 million to $1.5 million.
But replacement costs are only part of the problem.
A departing rep also takes customer knowledge, account history, pipeline context, and relationships with them.
The new hire then needs time to learn the territory, build trust with customers, and create a pipeline of their own.
During that transition, the territory may produce less revenue while the business continues paying for the replacement.
That makes territory design more than a way to divide accounts.
A poorly designed territory can create a chain reaction: weaker performance, lower earnings, rep frustration, and eventually turnover.
A well-balanced territory can help reps see a fair path to quota and give them a stronger reason to stay.
High Performers Leave First, Not Last
A high-performing rep can be excellent at selling and still struggle when the territory gives them little opportunity to work.
What happens next? They most likely quit.
One Reddit user sums up how territory takes precedence over talent:
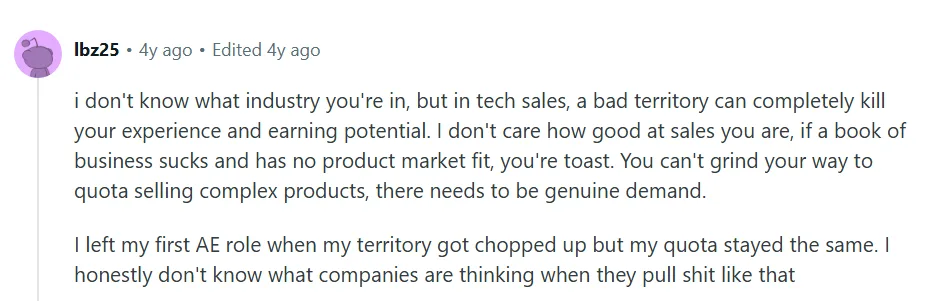
Source: Reddit
Another Reddit user makes the same argument from a different angle:

Source: Reddit
That is why territory design can become a retention problem.
Reps in weak territories struggle to create enough pipeline, miss quota, and earn less variable pay. Over time, they may start questioning whether they are underperforming or simply working with an unwinnable book.
Strong reps have even more reason to leave. They already know they can sell. If they believe their territory is limiting their results, another company can offer them a better book of business.
The Alexander Group, a go-to-market strategy company, found a similar pattern in one sales organization. Nearly 20% of reps were above 150% of quota, while just under half were below 50%.
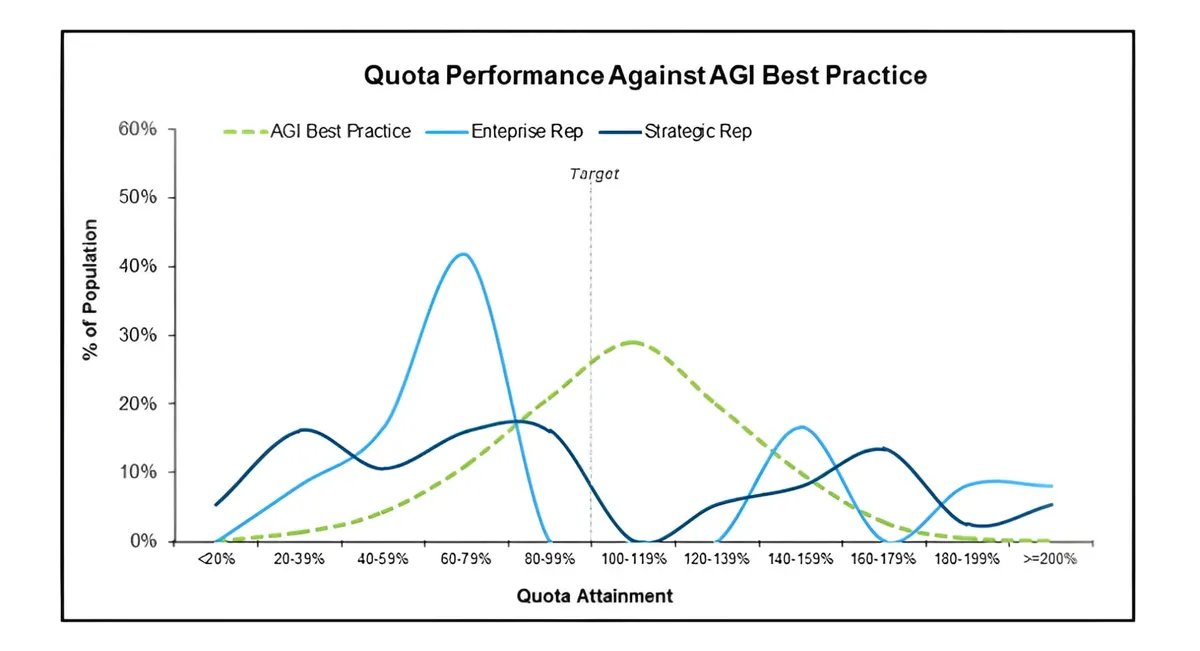
Source: Alexander Group
The reason becomes clearer when you look at how territories were assigned. Newer reps received greenfield territories with little existing revenue, while tenured reps kept stronger accounts and territories. New hires were also given larger quotas.
That created what the industry calls a bimodal distribution. Instead of most reps landing somewhere around the middle, performance split into two groups: reps far above quota and reps far below it.
The impact goes beyond quota attainment.
Reps in weak territories may leave because they cannot see a path to success. Reps with overloaded territories can leave because the workload becomes too much.
Either way, the business loses people who already know the product, customers, and sales process.
So when a strong rep walks out, the loss is not just another empty seat. It can mean lost revenue, lost customer relationships, and months spent getting a replacement up to speed.
Leaders Reach for the Wrong Lever
When reps leave, compensation is often the first thing leaders reach for.
And sometimes pay really is the problem.
But throwing more money at an unfair territory does not make the territory fair.
A study by marketing researchers Andris A. Zoltners and Sally E. Lorimer found that 56% of 4,831 territories across 18 sales forces were either too large or too small.
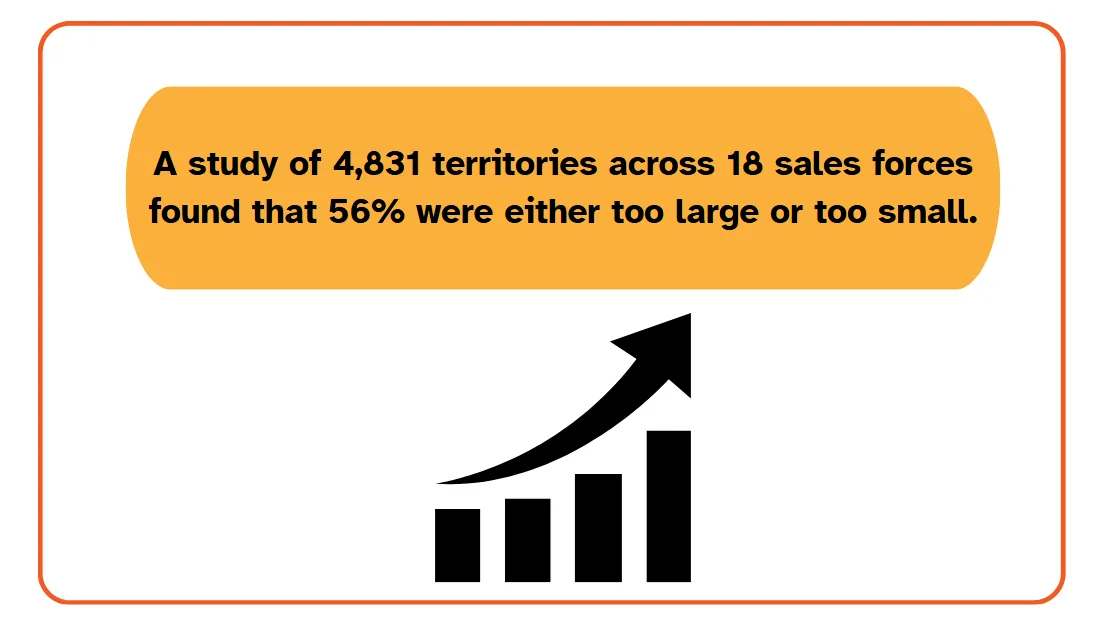
Illustration: Veridion / Data: Journal of Personal Selling & Sales Management
That is a territory design and management problem before it becomes a compensation problem.
A rep may have a strong compensation plan on paper, but what happens if the territory cannot support the quota?
Imagine a rep has a $1 million quota, but the territory contains only $700,000 of addressable opportunity. The rep is already facing a structural gap.
A richer commission plan does not create the missing $300,000.
Kyle Webster, Chief of Staff at Forma.ai, a sales platform, put it plainly during a webinar session with David Gerardi:
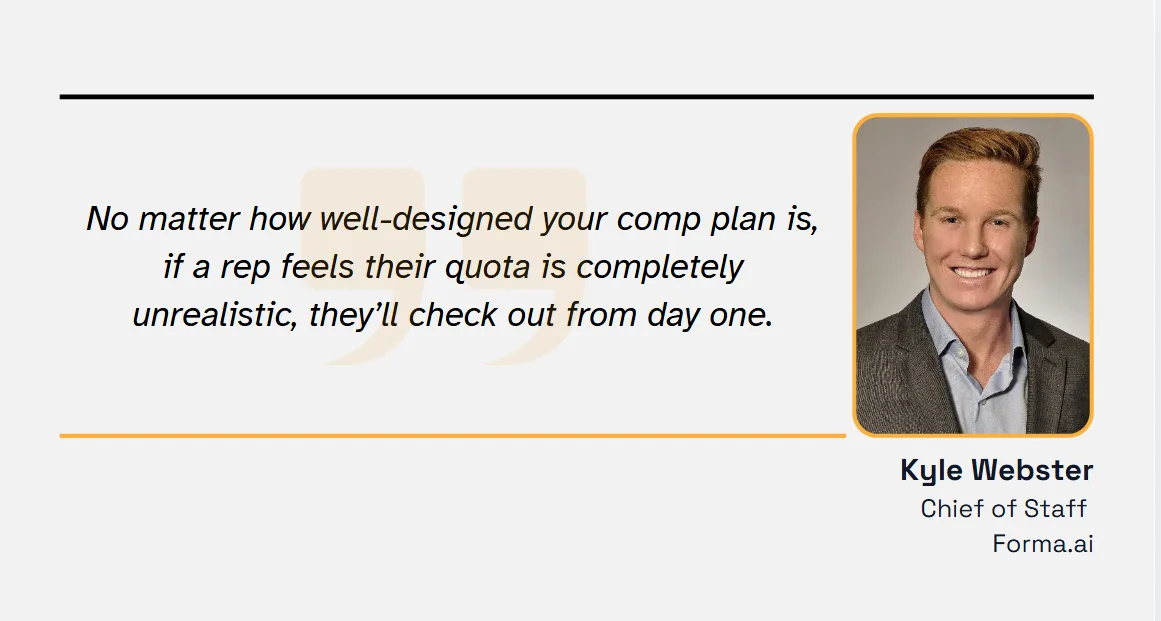
Additionally, when territories are badly sized, managers may respond by pushing harder, increasing activity targets, or micromanaging reps.
That creates another layer of pressure.
One Reddit user captures this exact sentiment, showing that even strong sales performance can be undermined by shifting quotas and poorly managed territories.
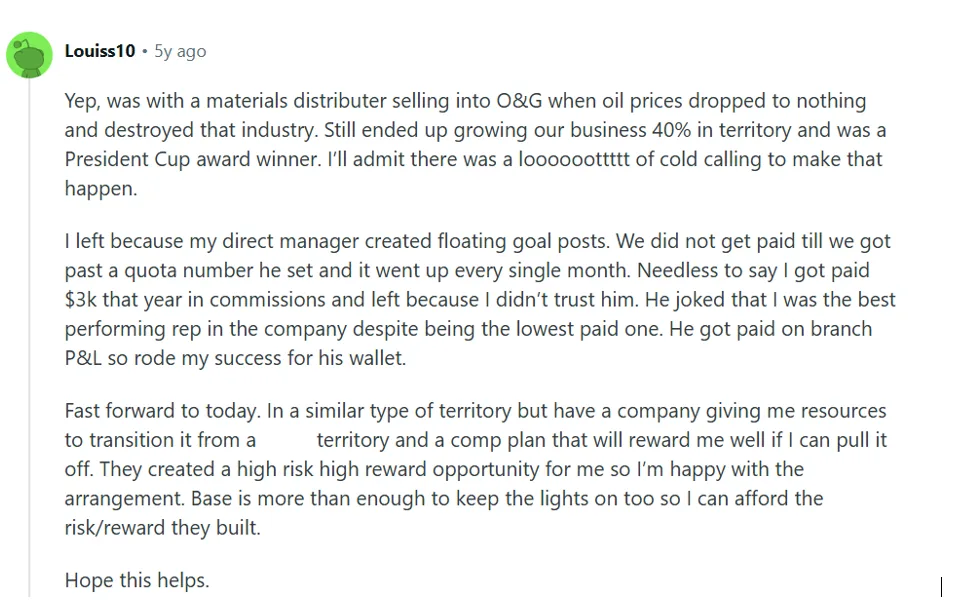
Source: Reddit
There is also another simple reason leaders and managers cannot ignore pay.
According to Salesforce’s State of Sales 6th Edition, 64% of sales professionals say they would leave if they received an offer for a similar job with better pay.
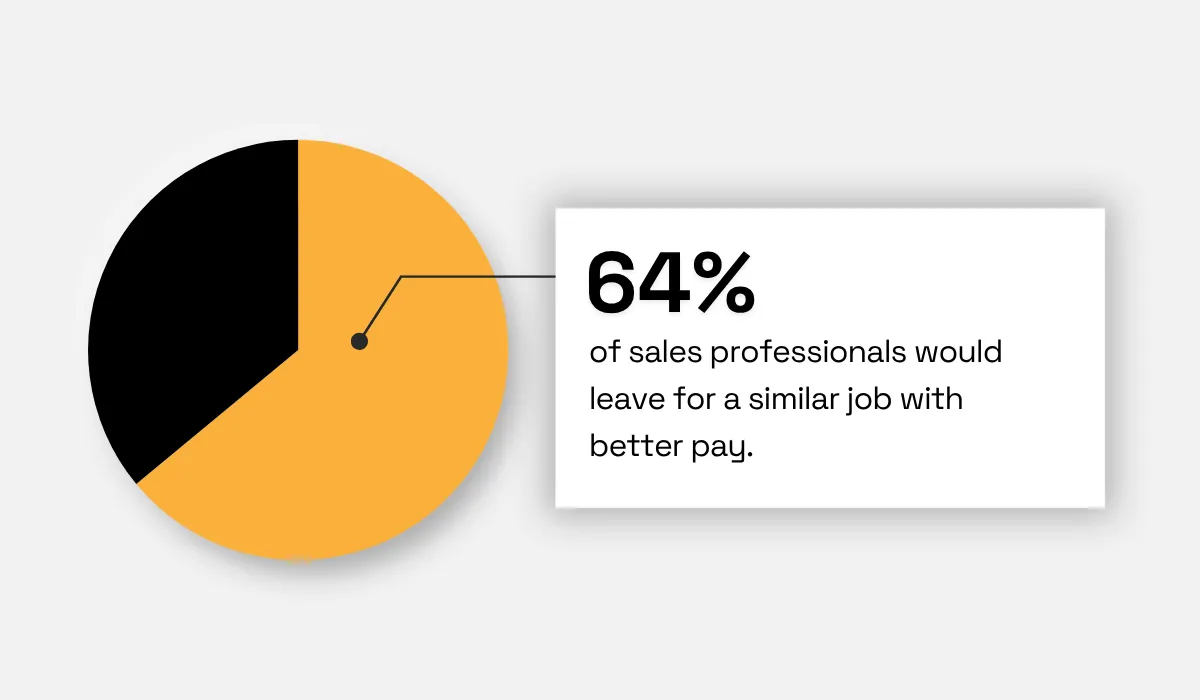
Illustration: Veridion / Data: Salesforce
So yes, compensation matters.
But ask yourself: if two reps receive the same pay plan and one gets a territory full of active accounts while the other gets a cold patch, is the problem really the pay plan?
The better fix is to examine the full equation: territory potential, workload, quota, and compensation.
Fix the territory first. Then you can see what compensation actually needs fixing.
How Firmographic Intelligence Enables Objective Balancing
Fairness starts with knowing what each territory actually contains:
- How many companies fit your ideal customer profile (ICP)?
- Where are they concentrated?
- How much revenue could they represent?
- And how much of that opportunity is sitting outside the view of your current territory plan?
Firmographic intelligence gives you the numbers to answer those questions instead of relying on guesswork or old territory maps.
Estimates Revenue and Total Market Potential
Two reps can have 100 accounts each and still have completely different opportunities.
Why?
One territory may contain large companies with strong revenue potential. The other may contain smaller businesses with far less room to grow.
This is where firmographic data changes the conversation.
Instead of asking, 'How many accounts does each rep have?' you can ask, 'How much potential does each territory actually contain?'
IBM used firmographic data to get a clearer view of revenue potential across its customer base.
Its Market Alignment Program combined historical transaction data with external firmographic details such as company sales and employee count.
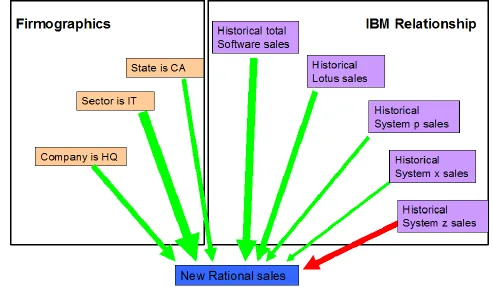
Source: IBM Systems Journal
This helped IBM estimate how much each account could realistically generate in future revenue, rather than relying only on past sales.
IBM then used those account-level estimates to guide sales resource allocation. The estimates were reviewed with frontline sales teams and adjusted using their market knowledge before being used for planning.
This gave IBM a more practical way to compare opportunities across accounts and decide where sales resources could create the most value.
The lesson is important for territory planning. The goal is not to give every rep the same number of accounts. It is to give each rep a fair share of the opportunity.
If your data misses companies, duplicates them, or places them in the wrong hierarchy, your territory potential calculation is already wrong.
And if the potential is wrong, how can the territory be fair?
Firmographic data gives you a more useful base. Company size, revenue, industry, location, and other company attributes can help estimate the opportunity inside each territory.
Now your territory plan is based on what reps can actually sell into, not just what happens to be sitting in a CRM export.
Shows Company Density and Growth Momentum
Think of two territories, each with 500 companies. One has 50 companies that closely match your ICP. The other has 150.
Would you still call those territories equal? Probably not.
Firmographic intelligence helps sales teams see where target companies cluster by characteristics such as industry, revenue, and location.
That gives leaders a clearer picture of where opportunities and workload are concentrated before accounts are split among reps.
The same study as stated above found that well over half of territories (~60%) had workloads that deviated by more than 15% from the ideal.
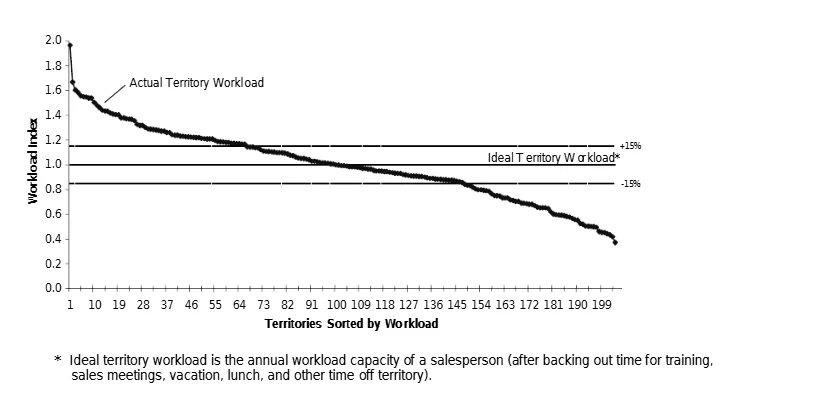
Why does that matter for territory planning?
Because the goal is not to fill every rep's book with accounts. The goal is to give each rep enough of the right accounts.
That changes how you think about balance.
A rep with 40 strong-fit companies may have a better territory than someone with 100 weak-fit accounts. The first rep may have fewer names to work with, but far more useful opportunities.
So when you map company density, don't stop at 'How many businesses are here?'
Ask another question: ‘How many businesses here actually matter to us?’
That is where firmographic balancing becomes more useful than a simple geographic split.
Ensures Accurate Number of ICP-Fit Accounts
A territory plan is only as good as the accounts inside it.
If your list contains companies that do not fit your ICP, your rep may have a full territory on paper and an empty pipeline in practice.
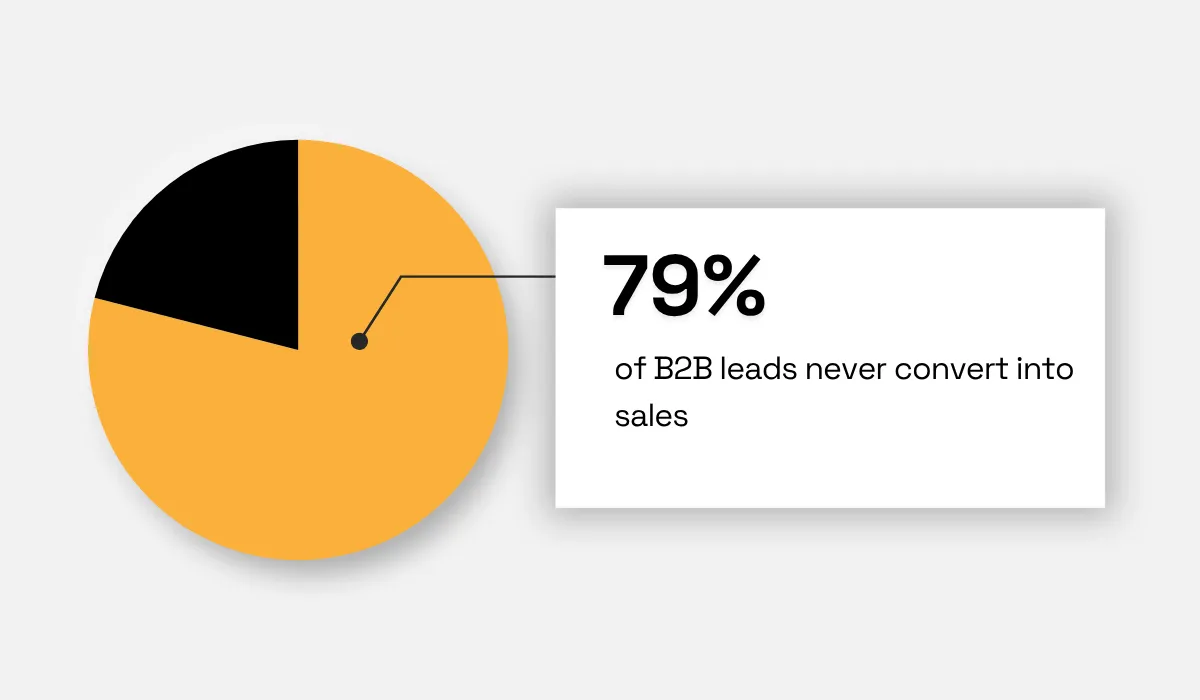
According to SalesPlay, 79% of B2B leads never convert to sales. That means a large share of the leads businesses generate never become revenue.
So why keep adding more accounts?
The better question is whether the right accounts are entering the territory in the first place.
Firmographic data helps answer that by filtering accounts against the traits that matter to your sales motion: company size, industry, revenue, location, and other attributes that define your ICP.
That matters because poorly aligned account data can send reps after prospects that were never a good fit.
The study by Zoltners and Lorimer, mentioned earlier, suggests that well-aligned databases typically combine 2–5 data sources and 20–100 attributes.
But unfortunately, many companies may not be following this.
There is another number that makes the ICP fit problem more attention-worthy: 17% of weekly outreach is wasted on dead or disconnected contacts.
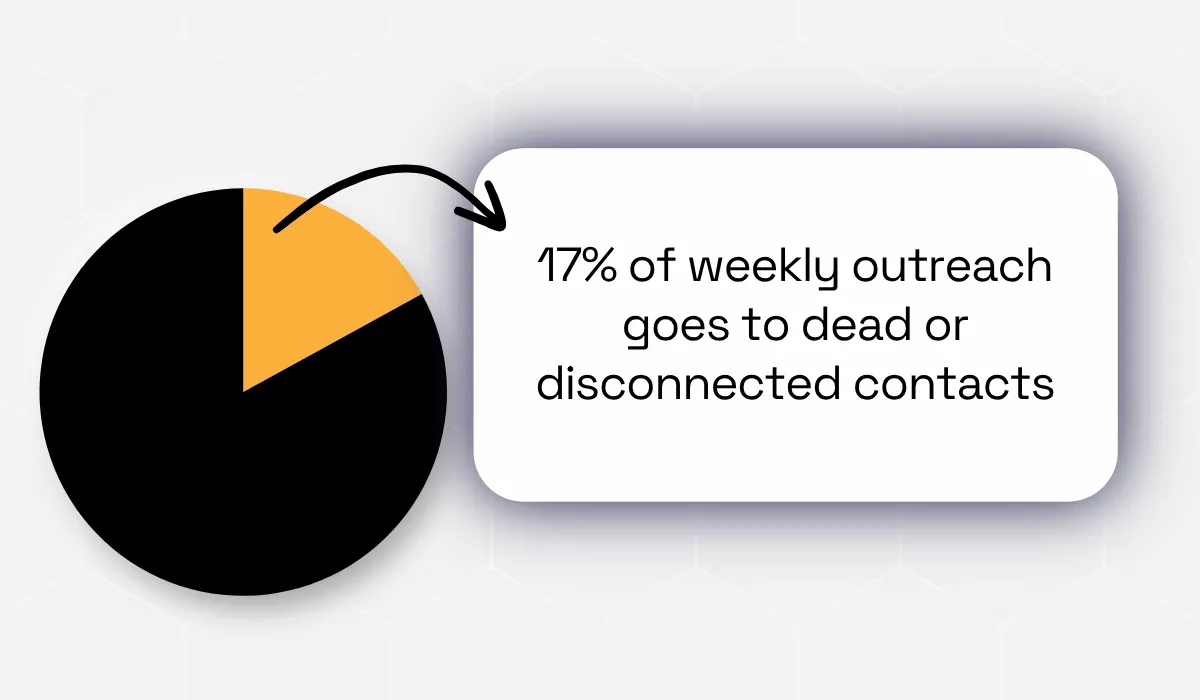
That is time reps cannot recover and could instead spend reaching accounts that match the ICP.
Remember, territory inequality is not only about revenue potential. It is also about workload.
If one rep receives hundreds of accounts but a large share is irrelevant, inactive, or disconnected, that rep has to spend more time sorting the territory before selling into it.
Another rep may receive fewer accounts that are much closer to the ICP.
This is why accurate ICP-fit account counts matter before you balance territories.
Start by asking what belongs in the territory. Then ask how much those accounts are worth.
Only after that should you ask how many accounts each rep should receive.
How Veridion Can Help
Territory planning only works when the data behind it is consistent across every market.
If one region has detailed company records while another has large gaps, two reps can be given territories that look equal but carry very different revenue potential.
Veridion can help balance that with company data built for global coverage.
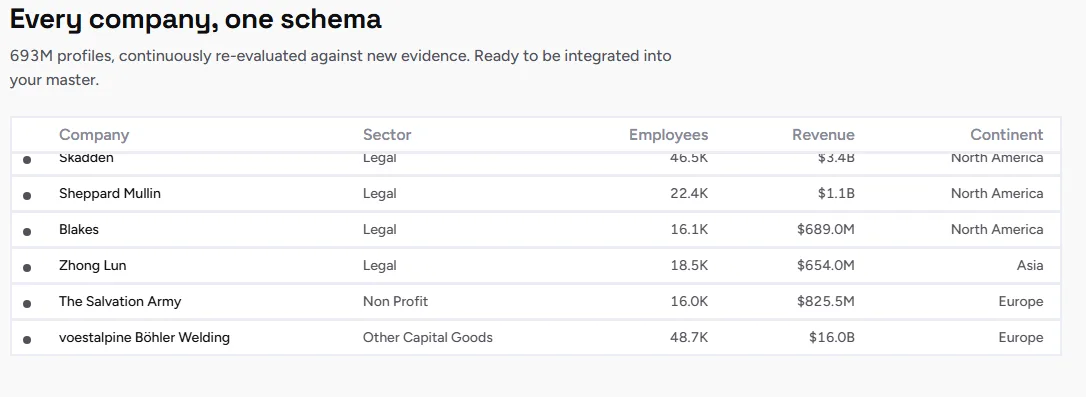
Its data includes company size, revenue, industry, business activity, location, and other attributes that can be used to compare markets on the same basis.
Source: Veridion
Further, Veridion’s coverage can support consistent, data-driven territory modeling in less familiar markets such as Southeast Europe and Southeast Asia, where local company data can be harder to compare with established markets.
With Veridion’s Search API, sales leaders can search for companies using combinations of attributes such as industry, geography, size, and business activity.
Instead of assigning one region to each rep and assuming the territories are comparable, teams can build territories around a more meaningful measure: comparable revenue potential per rep, creating a win-win situation for both the sales rep and the business.
Conclusion
Territory design is not just an exercise in dividing accounts. It can directly affect how much opportunity a rep has, how much they earn, and how long they stay.
Giving every rep the same number of accounts does not create fairness if those accounts differ greatly in value, fit, or workload.
Firmographic intelligence helps sales leaders see those differences before assigning territories. It can reveal where the best-fit companies are, how much revenue potential exists, and where workloads are uneven.
With that visibility, leaders can balance territories around real opportunity instead of outdated maps or account counts.
Articles
Discuss how these trends affect your organization.
Our analysts are available for a short call. Bring a specific question and we will ground it in the data.
Insights
Keep reading
More analysis, research, and outcomes grounded in live company intelligence.
4 Integration Patterns for Firmographic Data That Scale Without Breaking Your Pipeline
Tired of your firmographic data pipeline breaking? Uncover 4 scalable integration patterns that keep your data flowing smoothly.
How to Build a Firmographic Lead Scoring Model That Actually Predicts Revenue
Looking to build a firmographic lead scoring model? This guide will show how company data can help prioritize leads and improve revenue predictions.
Who Owns Your Company Data? A Framework for Firmographic Data Governance in RevOps
Who truly owns your company data? Understand firmographic data providers and establish robust data governance for RevOps success.