Insights / Articles
How to Assess Credit Risk for Private Companies with Limited Financial Disclosure
Credit risk assessment for private companies with thin disclosure means grading evidence, verifying identity and scale.

- Sort your evidence by how reliable it is before you draw conclusions.
- 99% of the 36.2 million US small businesses publish no financials at all.
- Whenever your sources disagree, investigate further before assigning a rating.
- Veridion builds company profiles from operating signals, even when the business files nothing.
A private company can legally owe the outside world almost nothing. In the US, no federal rule requires one to publish financial statements at all.
You, however, still have to price the exposure.
Frequently, the work becomes triangulation, separating evidence from inference.
Here is how that assessment runs, step by step.
1. Define the Risk Decision and Evidence Requirements
Before you gather anything, you need to establish what the assessment is actually for.
A $50,000 trade line and a $5 million revolving facility are both credit decisions, but they require a different standard of evidence.
US supervisors build their expectations around exactly that principle. The OCC’s Comptroller’s Handbook on lending and loan portfolio risk management instructs examiners to work within a risk-based supervision approach, so credit underwriting reviews should vary based on the size, complexity, and risk profile of the bank and its products and activities.
The FDIC applies the same logic to loan review, and its guidelines stipulate that the scope and complexity should vary based on a number of factors, such as:
- Institution size
- Type of operations
- Management practices
This paints a clear picture: scaling your effort to the decision is what supervision expects, not a shortcut you take because the file looks thin.
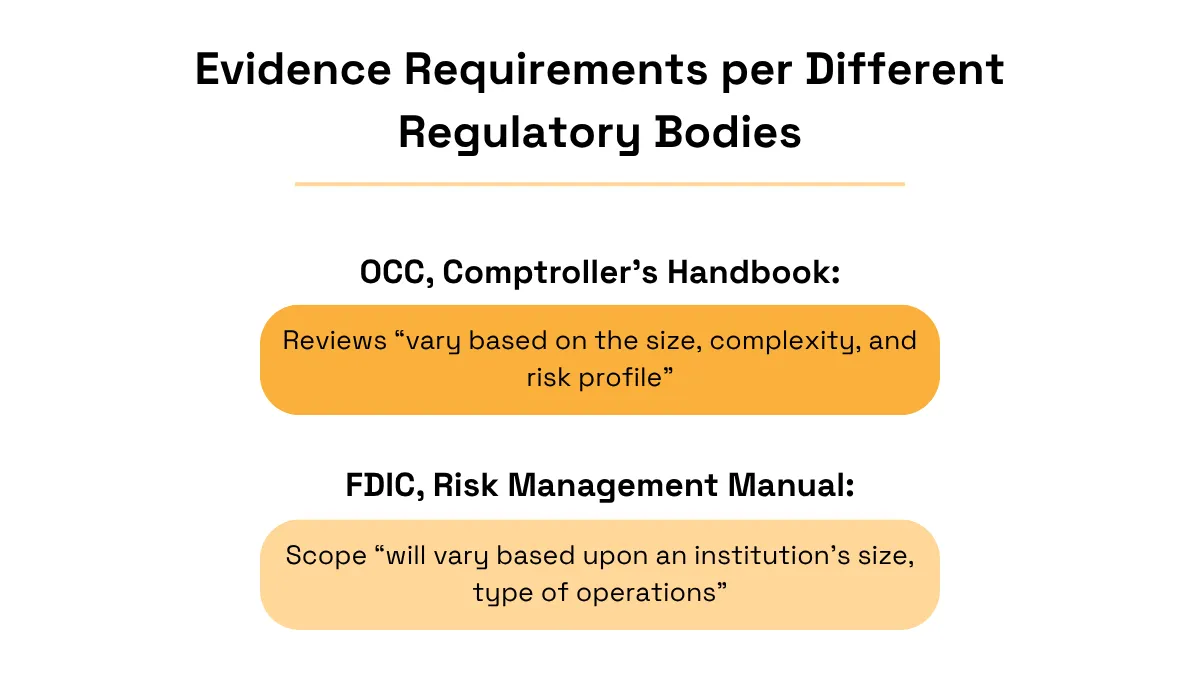
That principle also explains something that looks inconsistent from the outside. The same level of doubt can pass in one file and sink another because exposure (how much you stand to lose), tenor (how long the money is out), and concentration (how much of your book already sits with similar borrowers) decide how much uncertainty you can absorb.
In some respects, however, requirements hold regardless of the size of the decision.
The Basel Committee’s Principles for the Management of Credit Risk require credit-granting criteria to cover the borrower’s risk profile and characteristics, the purpose and structure of the credit, and its source of repayment.
Even with very thin disclosure, you’re never excused from covering any of them.
What this thin disclosure changes is how much of your conclusion rests on inference.
Dean Barr’s paper on the AI Transformation Gap Index handles that by sorting every input into evidence tiers and flagging any assessment built mostly from the weaker tiers as “Limited Confidence.”
In practice, set the threshold between weak and non-weak inputs now, before evidence starts arriving.
If you leave it until afterward, you risk talking yourself into a specific rating.
2. Gather and Classify the Available Evidence
Now comes the part that often gets rushed: collecting what evidence is outright available.
Collection shouldn’t be your only task here, however. You need to classify what you gather before you read a single number for meaning.
Otherwise, filed accounts and guesstimated headcounts end up sitting in your records as equals.
In fact, ISA 500, the international standard on audit evidence, sets out general principles for reliability that translate almost directly to credit work: evidence from independent external sources beats internally generated evidence, evidence you obtain directly beats evidence obtained by inference, documentary beats oral, and originals beat copies.
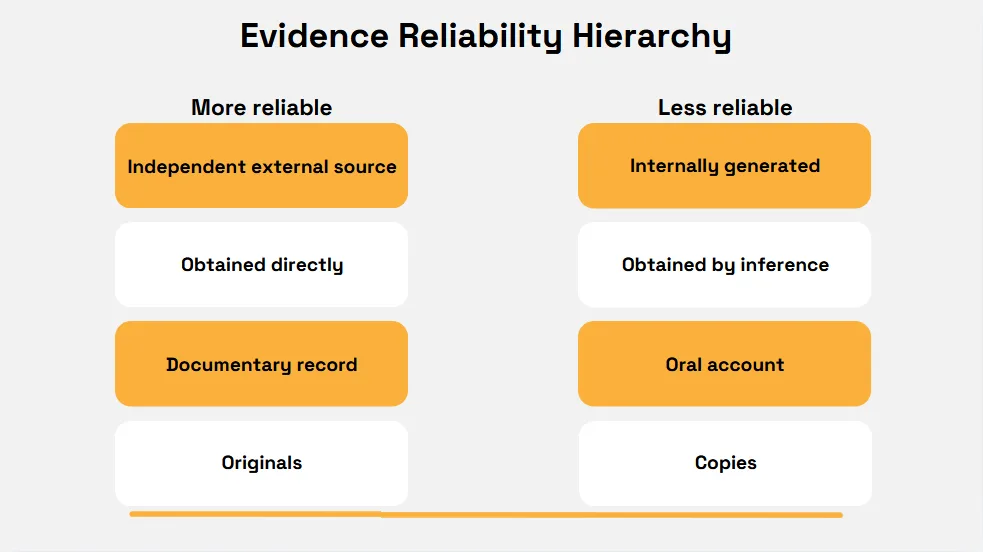
Illustration: Veridion / Source: International Federation of Accountants
That gives you a working hierarchy, with hard evidence at the top. From there, you work your way down through financial data disclosed by the company you’re reviewing, then verified facts confirmed against independent sources, then operational proxies, and finally, unsupported assumptions – which aren’t evidence and should be labeled as such.
Record four things against every input as you file it: source, publication date, jurisdiction, and reliability. Enrichment best practices cover the same ground from the data side, where accuracy and freshness decide whether a record is worth keeping around.
Without this level of due diligence, flimsy evidence will cause problems sooner rather than later.
The Prudential Regulation Authority reviewed how banks managed their private equity exposures, and found that because those exposures had never been tagged as such, most firms could not aggregate them automatically.
Rebecca Jackson, the PRA’s Executive Director for Authorizations, RegTech and International Supervision, put the consequence in one line.
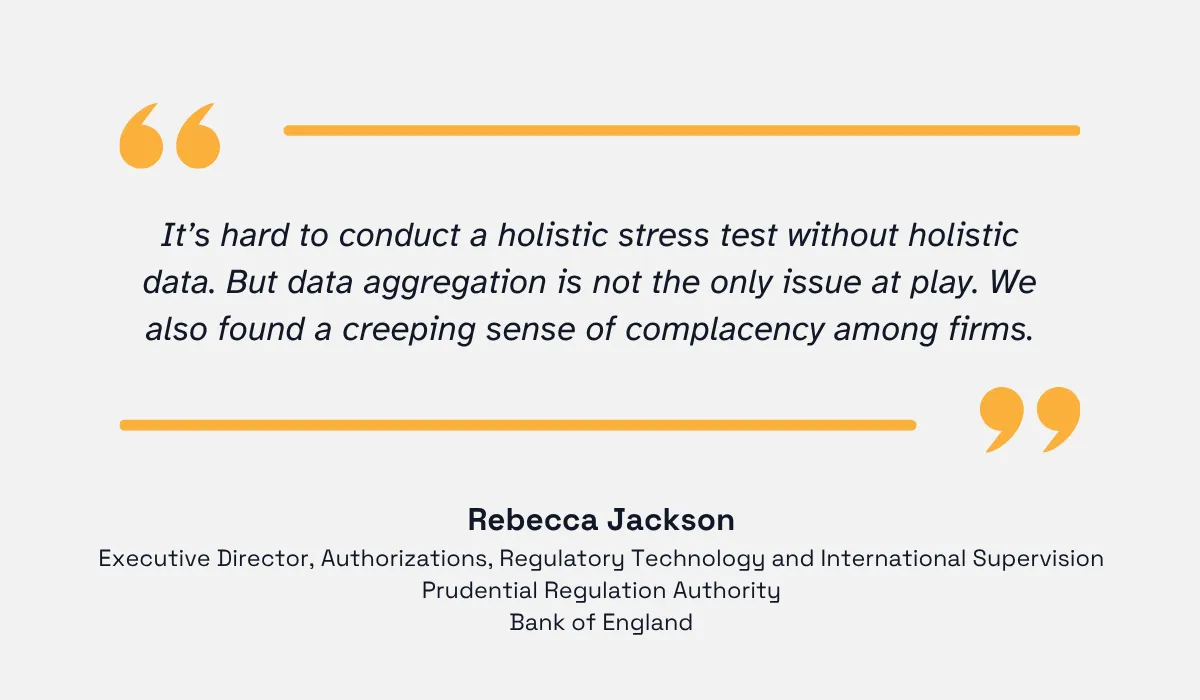
Illustration: Veridion / Quote: Rebecca Jackson’s speech for the Bank of England
The same goes for the credit file. Evidence that arrives unlabeled does not organize itself later, so label it as you go to avoid ending up with subpar information.
Lastly, write down what you could not find, too.
For example, modeling work on missing carbon data argues that because disclosure is voluntary, and willingness to disclose tracks size, sector, and geography, missing values should be treated as missing not at random.
In plain terms, a company that doesn’t disclose should be seen as substantially different from one that does, as the absence itself tells you something about who you’re dealing with.
3. Assess the Financial Data That Is Available
Whatever financials you do have, read them twice. Once for what the figures say, and once for what kind of document you are actually holding.
Start with the second reading, because it constrains the first. Ask yourself the following questions as part of the assessment:
- Were the accounts audited?
- How complete are they?
- Which framework were they prepared under?
- How old are the accounts?
Numbers that look fine at first glance still warrant a closer look. Accounts prepared on a different basis than last year's aren't comparable, and treating them as a trend is one of the most common unforced errors in private company analysis.
In the US, there are often no documents available at all, which further complicates things.
That’s because no single federal rule requires private companies to publish financial statements.
SEC reporting requirements only bite above the Exchange Act thresholds: more than $10 million in assets and a class of equity held by 2,000 or more people, or 500 or more who aren’t accredited.
Below that, nothing is filed publicly.
You might think digging at the state level would plug the holes, but it doesn’t.
Delaware’s search returns an entity name, file number, formation date, and registered agent. California confirms that ownership details aren’t made of record and that operating agreements aren’t filed at all.
Bottom line: all you get is scraps.
That applies to almost every company you will assess. The SBA counts 36.2 million US small businesses, 99.9% of all firms, against the 3,714 US-domiciled exchange-listed companies that file with the SEC.
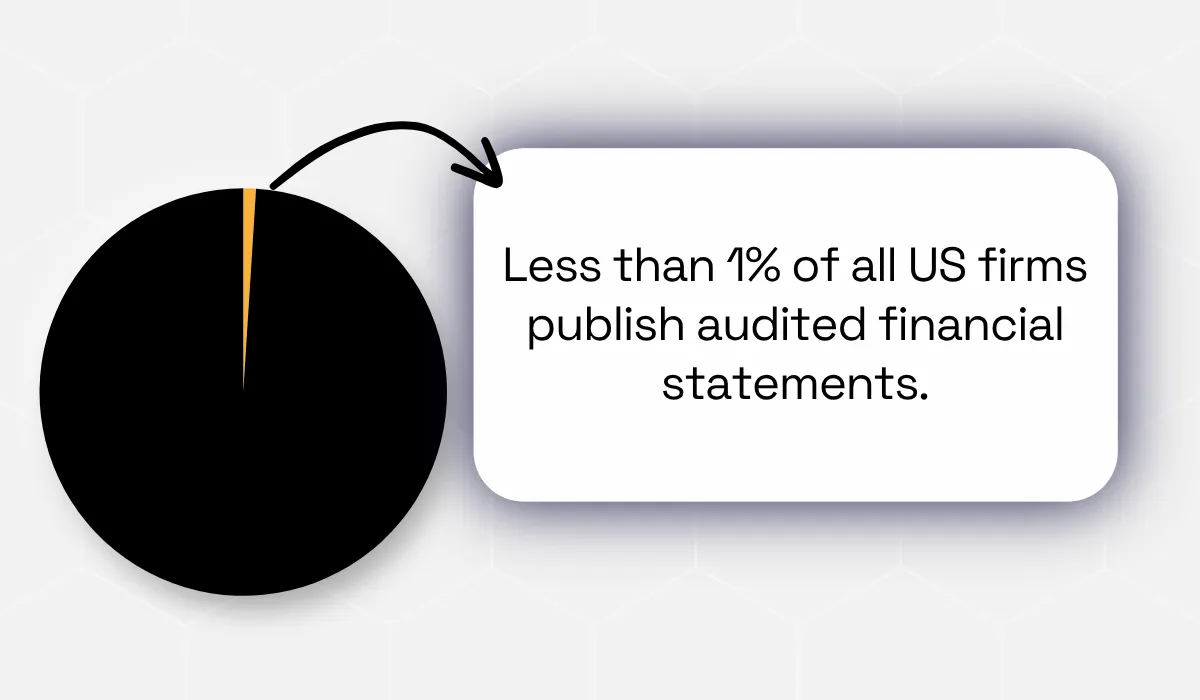
Illustration: Veridion / Data: SBA Office of Advocacy & SEC
You get more outside of the US, but less than you’d hope.
EU member states require audited accounts only from medium and large undertakings, according to the EU Accounting Directive.
UK private companies get nine months to file, while small ones can omit the profit and loss entirely.
When something does land on the public record, it’s either late, abridged, or both.
The takeaway is that missing or dated financials raise uncertainty, but they don’t necessarily show the company is a bad risk. Those are different findings.
Note your limitations, and go find corroboration elsewhere.
4. Verify the Company’s Identity and Corporate Structure
Everything so far assumes you know which company you are assessing.
But structures can be misleading, so confirm and establish a baseline first. Isolate the following information:
- Legal entities
- Registration status
- Ownership
- (Active) subsidiaries
- Parent companies
- Operating jurisdictions
Registries are your natural starting point. But they’re not 100% reliable.
The Global Legal Entity Identifier Foundation reports that around 99% of active LEI registrants have responded to the parent company question. This certainly sounds good and solved, until you read the fine print and dig for another document.
According to their Q2 2026 business report, only about 4% report a direct parent that itself holds an LEI, 89% report no parent at all under the accounting definition, and 3% is withheld from public view.
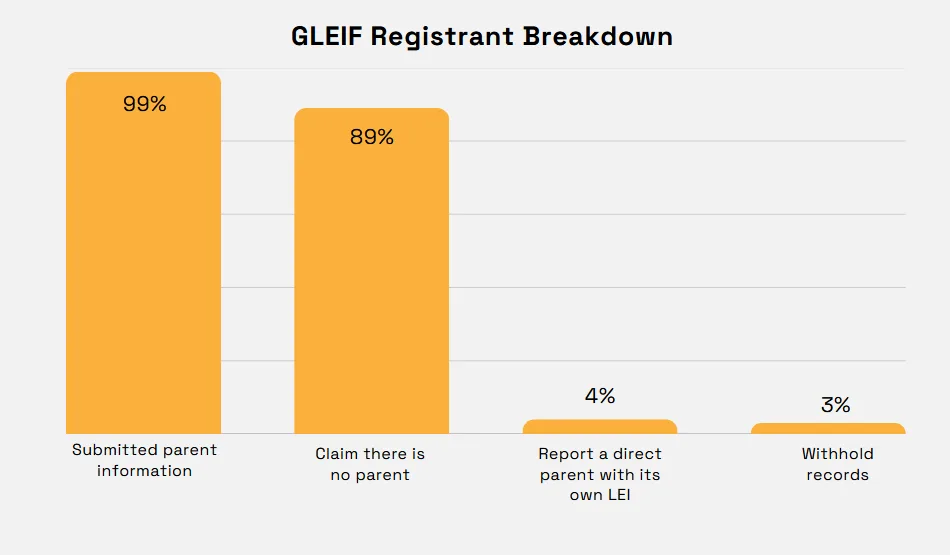
Illustration: Veridion / Data: GLEIF Q2 2026 Business Report
Ownership is thinner still. FinCEN in the US now exempts all entities created in the United States from beneficial ownership reporting following its March 2025 interim final rule, leaving only foreign-formed reporting companies in scope.
Thus, the overwhelming majority of the reporting population was removed in one stroke.
Globally, the picture isn’t better. The Financial Action Task Force’s own stocktake of mutual evaluations found 9% of countries meeting its effectiveness requirement for beneficial ownership transparency, the lowest score across every outcome it measures.
Structured private-company intelligence earns its place here. It establishes identity and corporate context from live operating signals where registry coverage runs thin.
Veridion took a Canadian numbered-company problem of exactly this shape: entities registered under a number with no trading name, sector or location an underwriter could use, and resolved a 5,000-company sample to their real businesses: 100% recovered a live website, trading name and NAICS code, and 99.3% were pinned to precise coordinates.
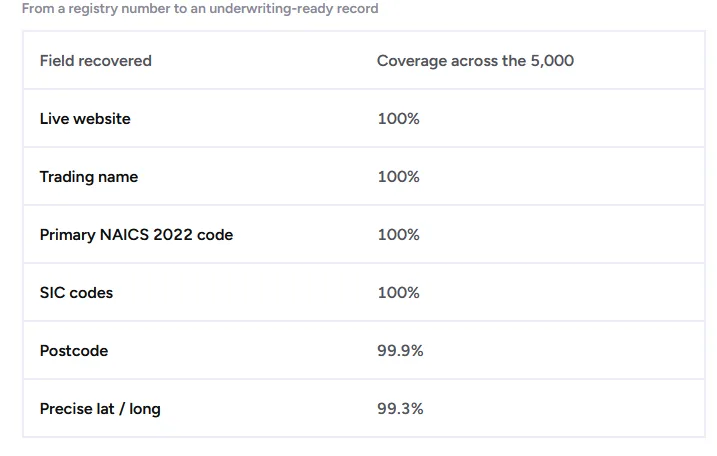
Source: Veridion
Resolving an entity this way has limits worth stating. It tells you the company exists as represented and what it does. It doesn’t tell you who owns it, and it’s no substitute for verifying the parent.
5. Validate the Company’s Operating Scale and Presence
You now know who the company is. The next step is testing whether what you can observe matches the size it claims.
The signals are the ones a company emits by operating: locations, workforce estimates, hiring activity, markets served, product coverage, digital footprint, facilities. Compare each against the claim. A manufacturer describing national coverage from a single leased unit tells you more by the mismatch than either data point does alone.
Brazel, Jones and Zimbelman tested whether non-financial measures corroborate reported performance, using signals like retail outlets, warehouse space and headcount. They found the divergence between financial and non-financial performance significantly greater at fraud firms than at their competitors.
Brazel put the reason bluntly:
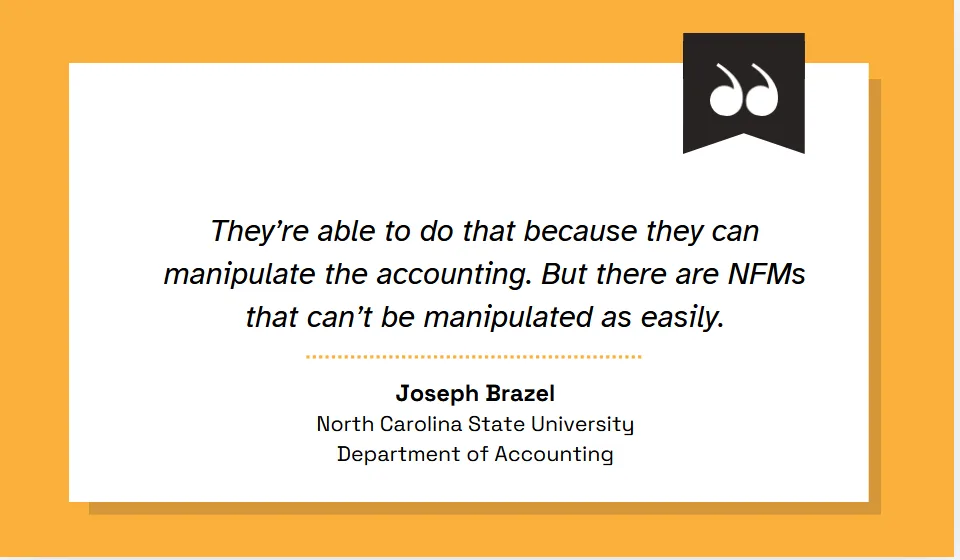
Illustration: Veridion / Quote: Joseph F. Brazel, NC State University
Their measures came out of company filings, though. Hiring signals come from the open web, where coverage is uneven.
Georgetown’s Center on Education and the Workforce estimates that 60 to 70% of openings are posted online, but coverage splits sharply by role: 80 to 90% for positions needing a degree, against 30 to 40% for those needing some college. A logistics firm and a software firm of identical size cast very different hiring shadows, and the logistics firm will look smaller on paper than it really is.
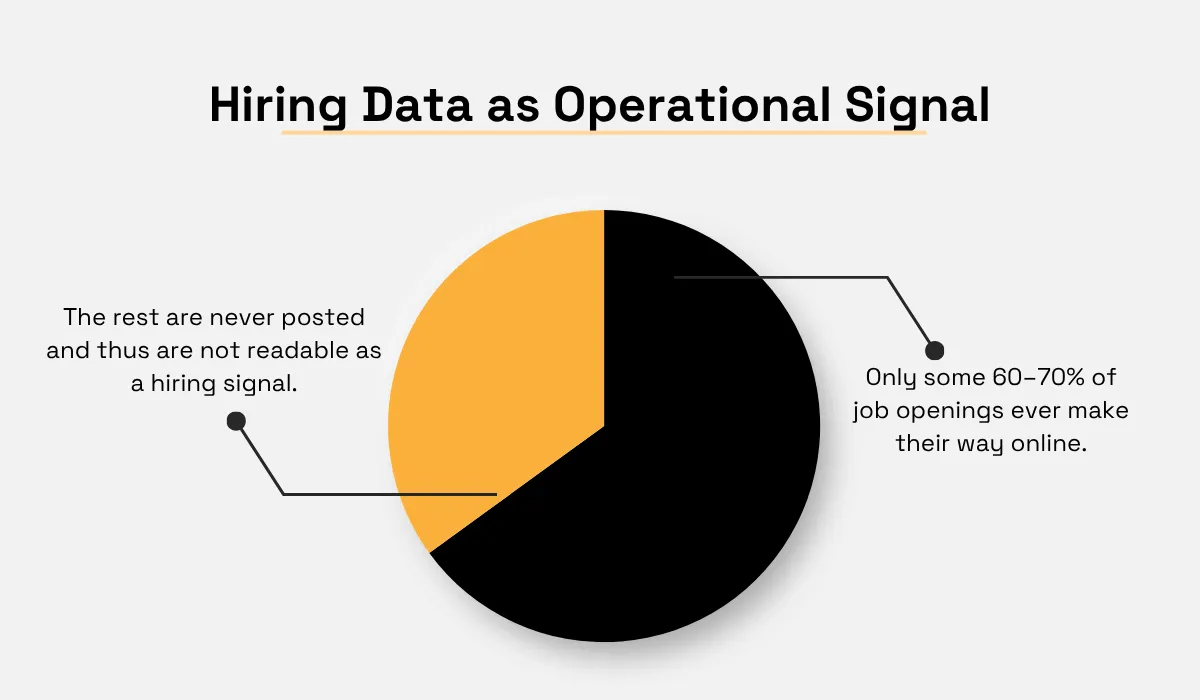
Illustration: Veridion / Data: Georgetown CEW
Don’t forget that this data is once again limited in terms of reliability.
For example, fifteen sites and steady hiring make a claimed size believable. What you don’t have is revenue, margin or a liquidity position. Veridion’s work on alternative firmographics covers how these signals perform alongside financial data.
6. Evaluate Business Activity and Growth Direction
Scale tells you how big the company looks. Direction tells you which way it is heading, and since credit is a claim on future cash rather than current size, that often bears more weight.
Read the observable developments together: hiring and layoffs, locations opening or closing, product and service changes, new partnerships, market coverage, management turnover.
In a vacuum, they won’t tell you much because it’s not possible to draw any meaningful conclusions; it’s just noise. But if you’re able to spot patterns and identify a few of these signals moving the same way over several quarters, that’s significantly more solid.
At the same time, you have more than just pattern reading at your disposal.
Under the US WARN Act, employers with 100 or more staff must give at least 60 days’ written notice of a plant closing or mass layoff, with notices published through state dislocated-worker units.
That is hard: documentary evidence of contraction, much stronger than your own assumptions.
Again, restrictions apply:
- Employers under 100 staff fall outside it entirely
- States have their own laws that may take precedence
- Part-time and short-tenure workers do not count toward the thresholds
- Exceptions exist for faltering companies and unforeseeable circumstances.
A clean WARN record doesn’t have to mean the company is stable, only that filings are limited.
These signals, even if softer, still earn their place, and research backs this.
SME default work evaluating thousands of model and subsample combinations found that changes in management, employee turnover, and mean employee tenure significantly improve predictive accuracy.
Management churn is a credit signal, not just an HR fact.
As always though, context matters.
A recruitment freeze in a seasonal business in its usual quiet quarter says nothing.
The same freeze in a sector hiring hard likely points to a real problem, which in turn impacts risk.
7. Triangulate the Findings and Assign a Confidence Level
You have evidence from several independent sources. Now it’s time to see whether they tell the same story.
Agreement between sources that could not have influenced each other genuinely strengthens a finding.
Disagreement is more useful, though, because it shows you exactly where to dig.
The triangulation work summarized by the American Accounting Association found auditors escalate to third-party evidence when management-controlled sources conflict. They raise their risk assessment only when that external evidence contradicts management’s account.
ISA 500 makes it an obligation, too. Where evidence from one source is inconsistent with another, the auditor shall determine what additional procedures are needed to resolve it.
Apply that to a credit file, and an unresolved conflict becomes a reason to keep working. The same logic governs the rating itself.
The AITG framework refuses to let a strong dimension offset a weak one, on the reasoning that a deficient input constrains what the whole assessment can support. Your weakest necessary input caps how confident your rating can be.
Then say how confident you are, claim by claim, and put it in writing.
SR 11-7 requires documentation detailed enough that someone unfamiliar with the work can understand its limitations and key assumptions. It also lists “conservative” adjustments to model output as one way to account for model uncertainty.
US intelligence analysts work to ICD 203, which requires every assessment to describe the quality and credibility of its sources, express and explain the uncertainties attached to major judgments, and distinguish underlying information from the analyst's own assumptions.
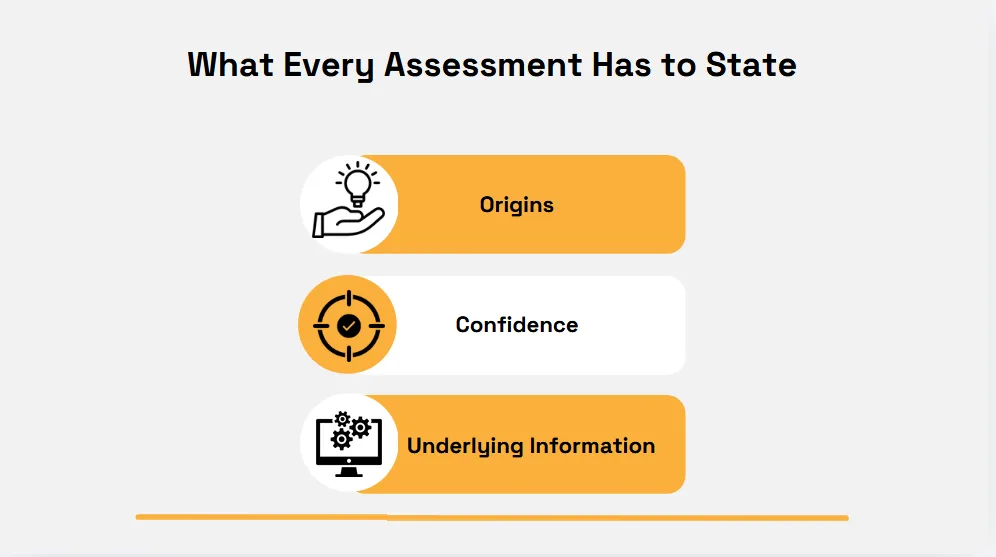
Illustration: Veridion / Source: Office of the Director of National Intelligence
Then close by listing what you couldn’t settle:
- Unresolved contradictions between sources
- Inputs too old to carry weight
- Findings resting only on proxies
Whenever that list runs too long, you have options. You could dig further before rating, recommend a lower exposure limit, or flag the rating as limited confidence and monitor the company instead of settling it today.
Whoever picks up the file next then knows what was established, what wasn't, and where to look first.
Conclusion
Limited disclosure is not a dead end. It’s a condition you work within, applying the same discipline you would to any evidence you sourced from somewhere outside your control.
The analysts who do this well aren’t finding more data than everyone else, but rather, they have a more robust, thought-out process that gives them more clarity about what they have and what they don’t.
Establish what you know, grade how well you know it, and name what is still missing. That is a defensible decision for any file.
Articles
Discuss how these trends affect your organization.
Our analysts are available for a short call. Bring a specific question and we will ground it in the data.
Insights
Keep reading
More analysis, research, and outcomes grounded in live company intelligence.
Best Practices for Data Enrichment
Learn how data enrichment best practices help businesses turn raw data into accurate and actionable insights.
What Are the Benefits of Data Enrichment?
Want to understand the benefits of data enrichment? This guide will explain how enriched data supports better decisions and analytics.
Using Alternative Firmographics for Faster SMB Credit Risk Assessment
Struggling with slow SMB credit risk assessment? Uncover how alternative firmographics can revolutionize your process and speed up decisions.