Insights / Articles
How to Design Sales Territories Using Firmographic Data (Without Leaving Money on the Table)
A step-by-step approach to sales territory design using firmographic data, from scoring accounts to balancing revenue potential across reps.

- Score accounts based on ICP fit, revenue potential, and growth.
- Only 26% of B2B organizations have 70%+ of reps consistently hitting quota.
- Balance sales territories around revenue opportunity, not account volume.
How do you decide which companies belong in your sales territory?
Starting with a map may seem logical, but geography alone can hide major differences between accounts.
Two businesses in the same city can have completely different revenue, employee counts, industries, growth profiles, and buying potential.
Veridion helps sales teams use fresh firmographic data to identify, filter, and assess accounts before assigning them to territories.
Once those attributes are visible, you can build territories around meaningful account groups and create a much clearer picture of the opportunity available to each sales rep.
Score Every Account, Not Just Every Territory
A fair territory starts with understanding the market before deciding how to divide it.
Not every company represents the same opportunity, and treating them equally can distort the final allocation.
Start by identifying the businesses that genuinely fit your target market, then determine which accounts deserve greater weight based on their potential.
Continue reading to see how to move from a broad market view to a more precise account-level assessment before assigning territories.
Define TAM by Company Attributes, Not Zip Codes
A zip code tells you where a company operates, but not whether it belongs in your target market.
That’s where Total Addressable Market (TAM) comes in
For B2B sales, your Total Addressable Market (TAM) should reflect the companies that can genuinely buy from you.
That means looking beyond location/geography and assessing attributes such as:
- Industry
- Revenue
- Employee count
- Growth stage
- Technology use
- Business activity
Consider two companies in the same city.
One has 2,000 employees and generates substantial revenue, while the other has 20 employees and a much smaller commercial footprint.
Both are part of the geographic market, but they do not represent the same addressable market opportunity.
This is where firmographic data becomes useful.
It shifts the question from “Which companies are in this area?” to “Which companies in this area fit our market?”
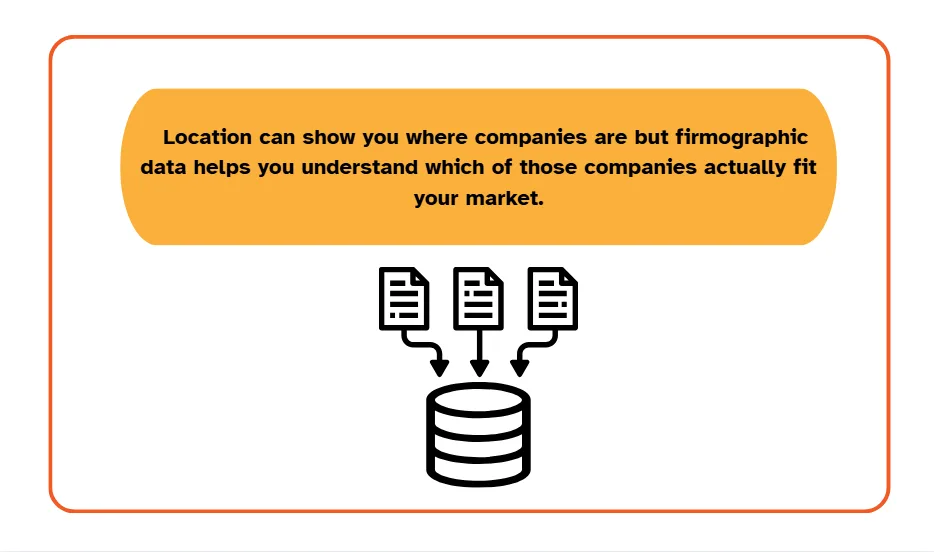
Illustration: Veridion
Your sales territory should give reps more than a list of companies to contact. It should help them understand which accounts are actually worth pursuing.
Firmographic data can add that context by showing where your ideal customers are concentrated, which segments have the highest account density, and where your TAM may be larger or smaller than expected.
You may already have the right information on company size, industry, location, and revenue sitting in your systems.
Use that data to clearly define your TAM, and it should show where your real market is.
Weight Accounts by Revenue Potential and ICP Fit
Once you've defined your TAM, don't treat every account as equally valuable.
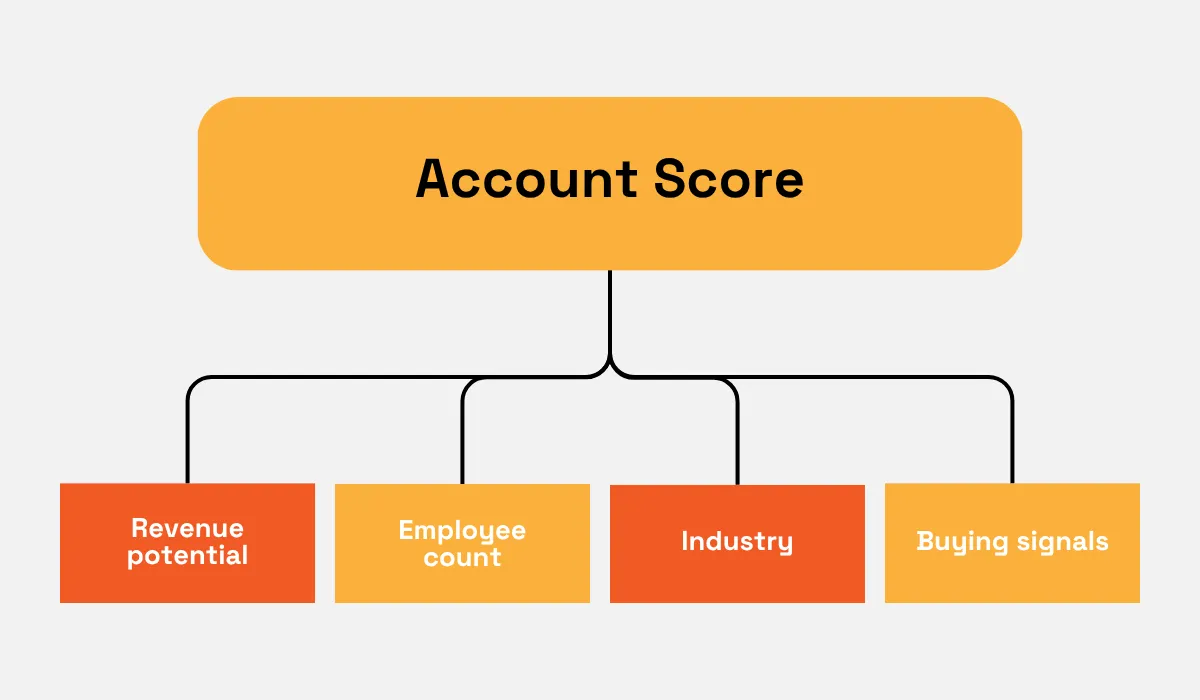
A strong territory model gives greater weight to accounts that combine Ideal Customer Profile (ICP) fit with meaningful revenue potential.
Start by scoring each account against factors such as the ones shown below.
Source: Verdion
The goal is not to create another spreadsheet score that nobody uses.
These scores should directly influence territory design, so reps receive a mix of accounts that reflects the opportunity available in the market.
Alight, an employee benefits administration platform, provides a useful example.
Its sales coverage redesign identified $1.58B in potential to cross-sell across the existing account base.
The company then used segmentation and propensity-to-buy analysis to determine which accounts deserved greater attention and how to allocate resources.
The recommended model moved away from distributing accounts simply by geography and instead considered potential when assigning ownership.
This matters because account count can create a false sense of balance.
Two reps might each receive 100 accounts, yet one territory could contain far more high-fit, high-value opportunities than the other.
Score the opportunity before you divide the territory.
Otherwise, territories can look balanced in your CRM while being heavily skewed in actual sales potential.
Filter and Measure Territory Potential Before Assigning Accounts
Now you know which accounts matter.
The next question is where those accounts sit and how they should be grouped.
Here’s how to understand the opportunity inside each territory before handing it to a sales rep.
Filter Simultaneously by Location, Industry, and Size
A single attribute rarely creates balanced sales territories. A better approach is to layer location, industry, company size, and other ICP signals together.
That is difficult to do well when territory planning still depends on spreadsheets.
According to The State of Sales Compensation 2025, 50% of sales teams report using spreadsheets, which can make it difficult to bring multiple account attributes together and identify where the strongest opportunities are concentrated.
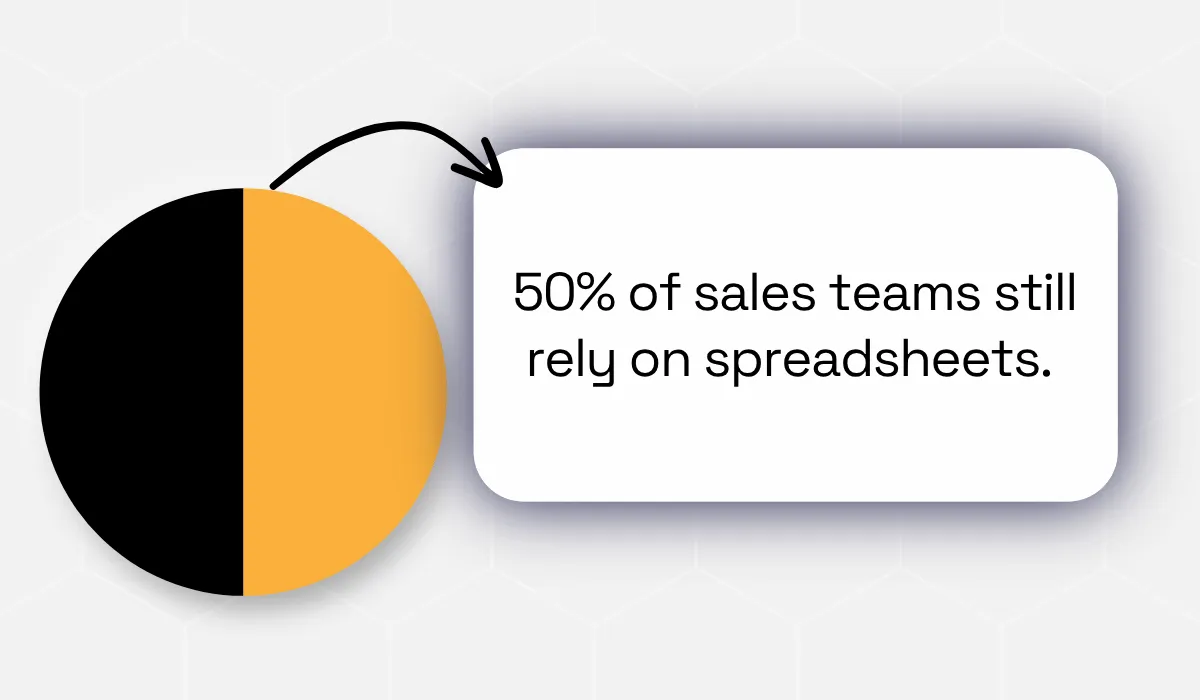
Illustration: Veridion / Data: The Alexander Group
Veridion makes this type of filtering more automated and practical.
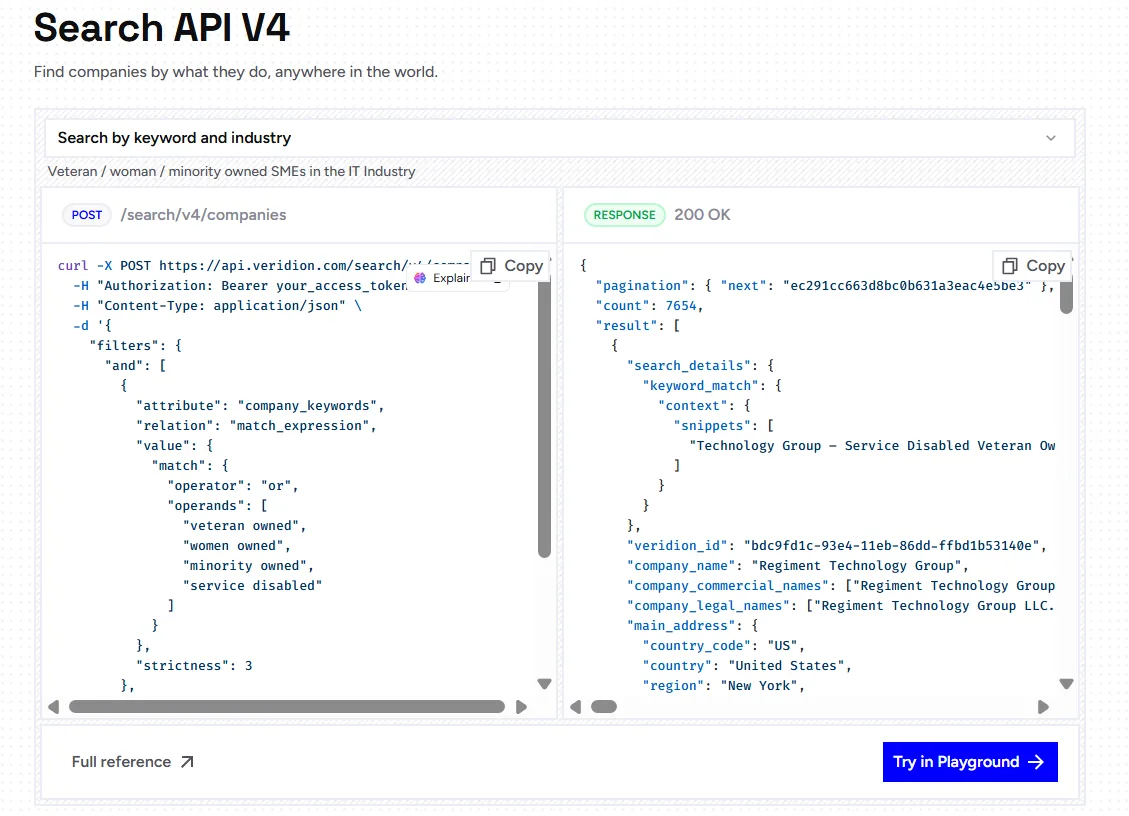
Its Search API can identify companies using combinations of industry, geography, size, keywords, and other signals, with underlying company data covering employee count, revenue, business activity, industry classifications, technology, and location.
Source: Veridion
With our market intelligence, teams can see where specific types of opportunities are concentrated.
For example, a rep covering the Northeast could focus on software companies with 100+ employees and specific technology or business-activity signals.
Another rep could cover smaller manufacturing businesses in the same region.
The boundaries overlap geographically, but the actual sales territories are distinct.
Surface Hidden Imbalances Before They Become Rep Complaints
A territory can look balanced on a map while giving reps very different chances of hitting quota.
That difference can show up directly in revenue. Salesforce estimates that unbalanced territories can cause organizations to miss up to 7% of revenue.
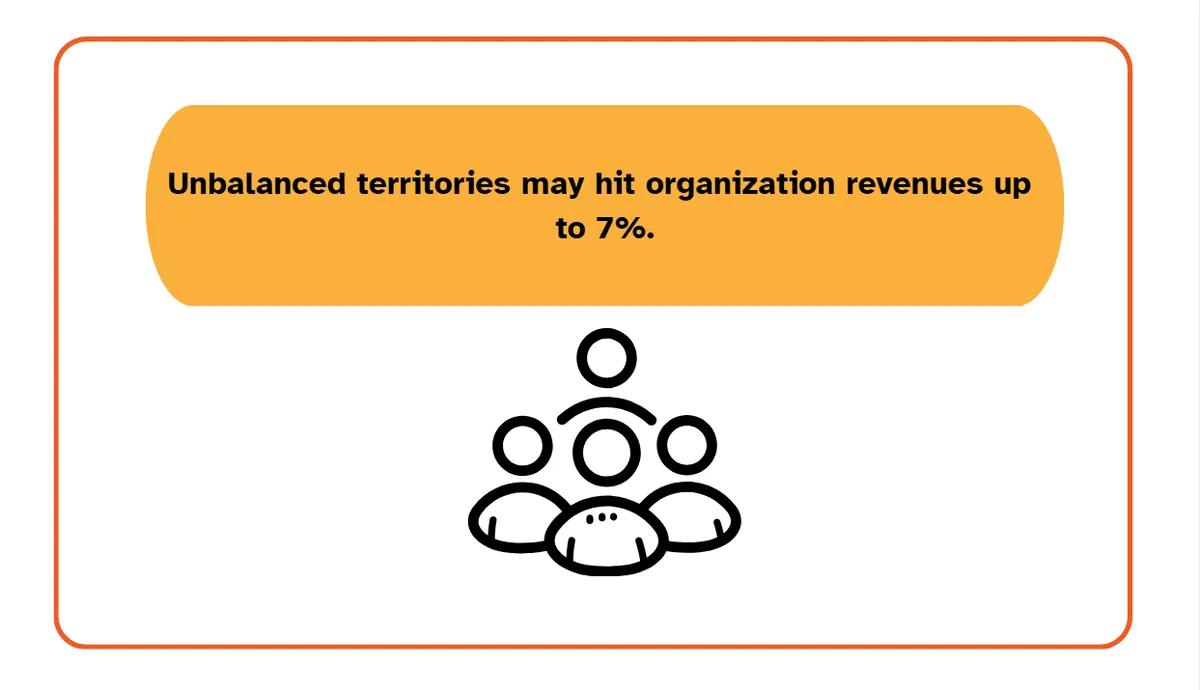
Illustration: Veridion / Source: Salesforce
Why does that happen?
One rep may inherit a territory packed with large, fast-growing accounts, while another gets a similar number of companies with far less buying potential. The map may look evenly divided, but the commercial opportunity is not.
The same principle applies when you assess an existing territory. Look at the revenue potential, firmographic fit, account quality, customer activity, and workload behind the accounts assigned to each rep.
A territory with 500 companies is not necessarily equivalent to one with 500 companies.
If one contains more high-value accounts, stronger growth prospects, or a larger concentration of your ICP, the two reps are starting from very different positions.
The takeaway is simple: balance the opportunity, not just the number of accounts.
A territory becomes more equitable when reps have comparable commercial potential to work, rather than simply comparable numbers of companies.
Build Balanced Territories From the Data
After filtering the market and scoring the accounts, it’s time to build the territories.
Balance is key here.
Handing out the exact same number of accounts to everyone sounds fair, but it often has a different result in practice.
A territory with fewer accounts might actually hold much higher potential, while a larger patch with more companies can be far harder to work.
The goal is to give each rep a realistic opportunity to succeed.
Equalize Total Addressable Revenue, Not Account Count
Imagine two reps, each handling 100 companies. One manages several large accounts with complex buying processes. The other has smaller accounts that require less sales attention.
On paper, both reps have the same number of accounts. In practice, their revenue opportunity and workload can be very different.
That is why territory design needs to look beyond how many companies are assigned to each rep.
Workload could be a useful way to capture the difference between a territory that looks full on paper and one that actually demands more selling effort.
This is reflected in Axtria’s 2024 Territory Design and Refinement Benchmarking Study, based on more than 30 US life sciences organizations. The study found that workload had an average 73% weighting in territory design.
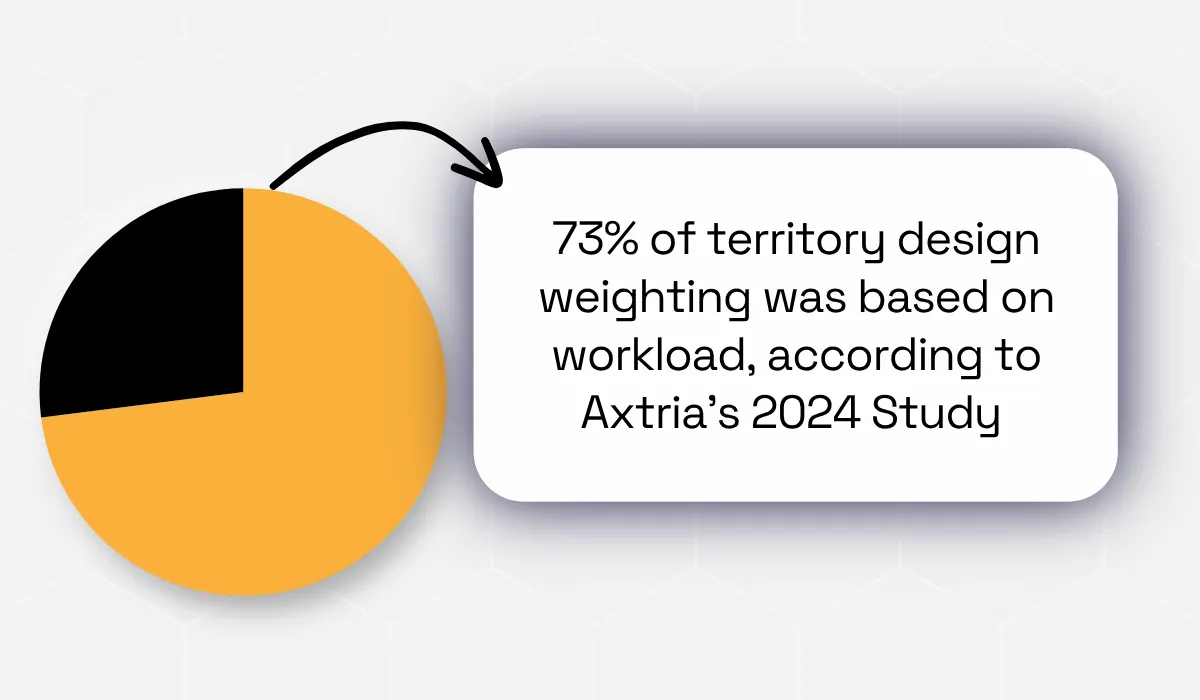
That means workload was given far more consideration than a simple account-count approach would capture.
A territory with fewer accounts can still require more rep capacity if those accounts involve larger opportunities, longer sales cycles, more stakeholders, or greater account complexity.
So the goal should be to balance the revenue opportunity and effort required, not simply the number of accounts.
Start with total addressable revenue. Then look at the number of accounts, expected deal size, sales cycle, account complexity, and rep capacity.
You also need to consider growth.
A small company today may become an important account later. If every high-growth company ends up with one rep, that territory may become overloaded next year.
In other words, territory design should account for account growth trajectories, not only current account value.
The question isn't "Does every rep have 200 accounts?"
Instead, ask: "Does every rep have a fair share of the revenue opportunity?"
Balance Industry Mix Across Territories
Two sales reps may cover the same-sized regions, yet one could inherit a concentration of financial services accounts while the other manages manufacturing or technology companies.
A comment on one Reddit post captures how complex territory design can become:

Source: Reddit
In the same context, instead of treating every company in a region as part of the same sales patch, you can layer different factors:
For example, East Coast and Financial Services could form one territory, while East Coast and Manufacturing form another.
Or go further, layering geography, industry, company size, and product fit in sequence.
But remember, industry should not become another source of imbalance.
If one rep's territory is dominated by a single sector, a downturn in that industry can affect their pipeline harder than it would affect a more diversified territory.
So look beyond how many accounts or how much revenue each territory contains. Check how that opportunity is distributed across industries.
The goal is not to eliminate specialization. It is to know when specialization creates an advantage and when it creates concentration risk.
Keep Territories Balanced as the Market Shifts
Companies change, new prospects enter your market, and existing accounts stop fitting your ICP. Reps change roles, too.
That means a territory that felt balanced in January can easily fall out of alignment six months later.
But constant reshuffling isn't the answer either.
You need a review system that catches meaningful changes without turning territory management into a monthly exercise.
Review Quarterly, Redesign Annually
Start with quarterly reviews.
That gives you enough time to spot changes without constantly moving accounts between reps.
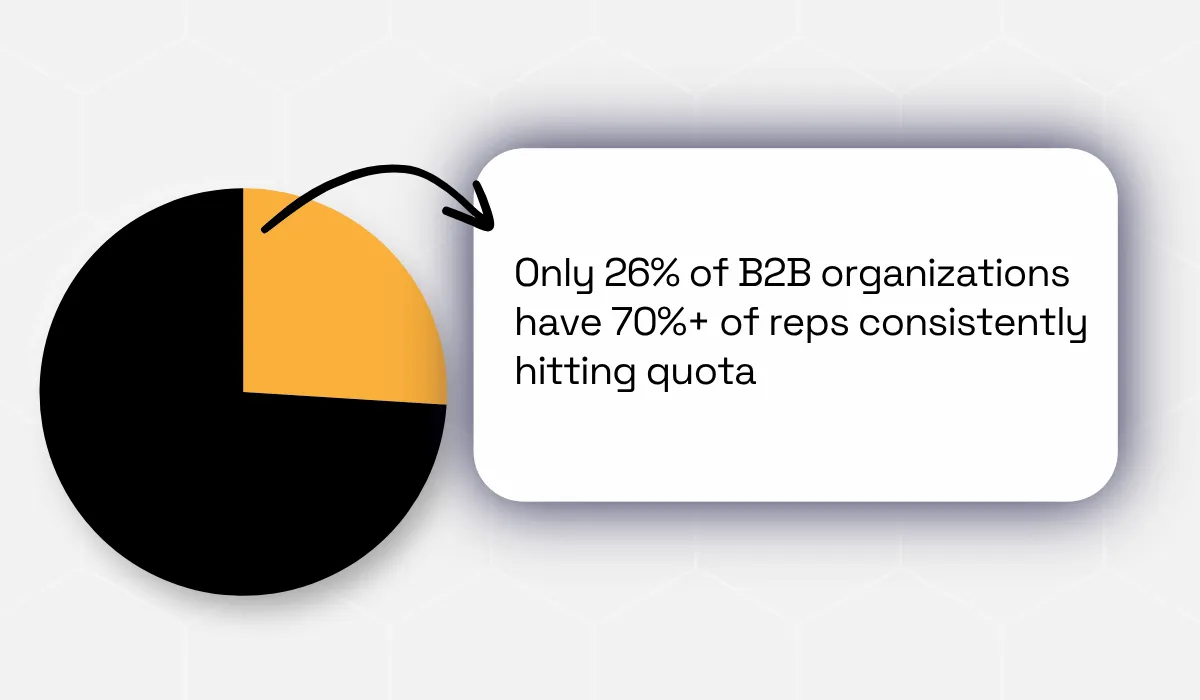
The State of Field Sales 2026 report from SPOTIO found that only 26% of surveyed B2B organizations have 70% or more of their representatives consistently hitting quota.
The same report found that roughly 13% of them cannot track their metrics.
That gap deserves attention.
If the company is growing but most reps are missing quota or are unable to track it, we shouldn’t immediately assume the reps are the problem.
Instead, we can look at quota attainment, revenue per territory, pipeline coverage, account penetration, and account growth.
If one territory keeps outperforming while another consistently struggles, ask yourself why.
At the same time, don't redesign everything every quarter as frequent territory changes can disrupt sales activity.
Quarterly territory reviews with annual realignment can make for a good strategy, unless a significant change demands an earlier adjustment.
But here’s an important note: no amount of territory strategy can compensate for unreliable account data.
In fact, 44% of sales reps cite outdated data as their single biggest headache.
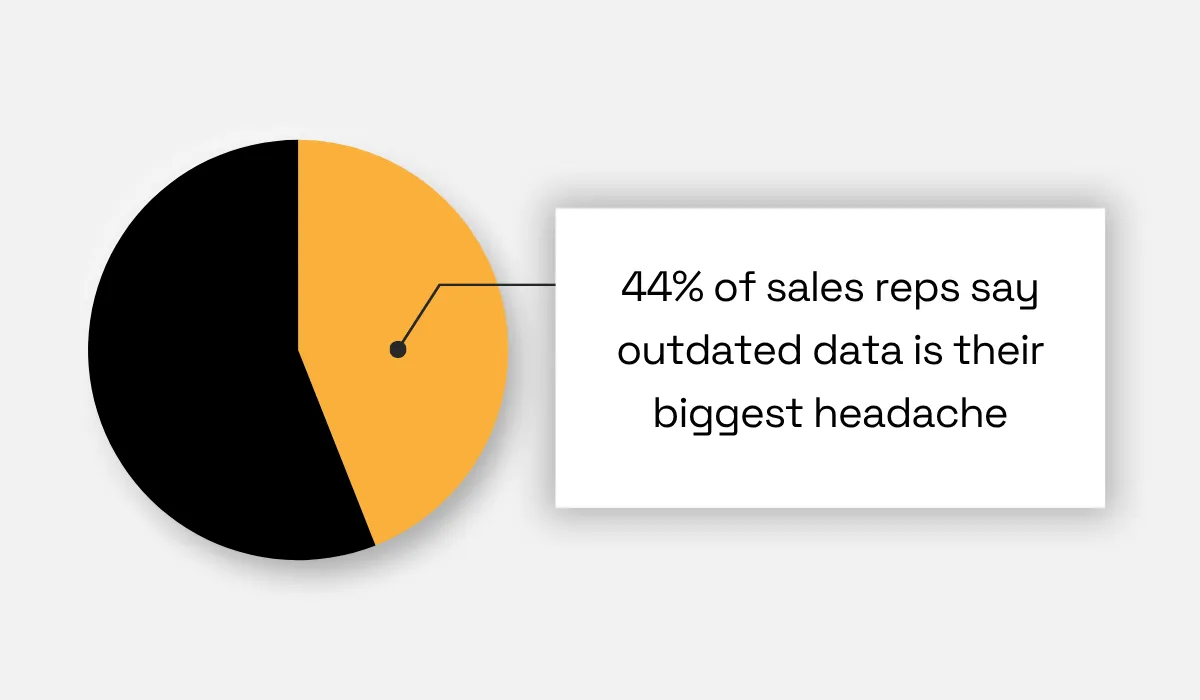
Illustration: Veridion / Data: Markets&Markets
If a company changes size, industry, location, ownership, or business direction, your territory model needs to reflect that change.
Otherwise, reps may be assigned accounts based on information that is no longer true.
Fresh firmographic data is therefore the foundation for keeping territory decisions accurate as the market changes.
Conclusion
A strong sales territory is not simply a collection of companies within a geographic boundary. It reflects account value, ICP fit, industry mix, revenue potential, and rep capacity.
Start by scoring accounts, then use those insights to build territories around genuine opportunity.
Review them regularly, but avoid constant reshuffling that disrupts productive sales relationships.
Most importantly, keep the underlying company data fresh. As businesses grow, move, change industries, or become less relevant to your ICP, your territories need to keep pace.
Articles
Discuss how these trends affect your organization.
Our analysts are available for a short call. Bring a specific question and we will ground it in the data.
Insights
Keep reading
More analysis, research, and outcomes grounded in live company intelligence.
How to Connect a Firmographic Data API to Your CRM, CDP, and BI Stack (A Technical Guide)
Struggling to integrate firmographic data providers? This technical guide shows you how to connect their APIs to your CRM, CDP, and BI stack.
How to Build a Firmographic Lead Scoring Model That Actually Predicts Revenue
Looking to build a firmographic lead scoring model? This guide will show how company data can help prioritize leads and improve revenue predictions.
When Firmographics Aren't Enough: How to Know It's Time to Layer in Behavioral Data
Tired of firmographic data providers falling short? Discover when to layer in behavioral data for a complete customer picture.