Insights / Articles
Private Equity Market Mapping: From Thesis Criteria to a Complete Company Universe
PE firms see a median 17.6% of deals that fit their thesis. Close that gap with market mapping in four steps, from criteria to a universe you can defend.

- SPS reported a median deal coverage of 17.6% among participating PE firms for 2024.
- Combining search methods finds companies missed by one keyword or industry code.
- Companies can appear in several segments but count once in the total universe.
- Coverage checks reveal gaps; they do not prove that the map is exhaustive.
Private equity market mapping turns an investment thesis into a documented universe of relevant companies. It involves defining inclusion criteria, searching for businesses, classifying their activities, and resolving duplicate records.
Missing relevant companies can leave opportunities unexplored, while including unrelated businesses adds unnecessary review work. Veridion helps teams search company data by business activity, geography, products, and firmographic attributes to build that universe.
How to Build a Private Equity Market Map
Building a private equity market map takes four steps: define the market boundary, translate your thesis into searches, classify companies, and deduplicate the results. Build and validate this universe before ranking companies or starting outreach.
Each step should preserve enough evidence for your team to understand why a company belongs in the map and where gaps might remain.
The workflow below shows how thesis criteria become a company universe, followed by coverage checks and ongoing updates:
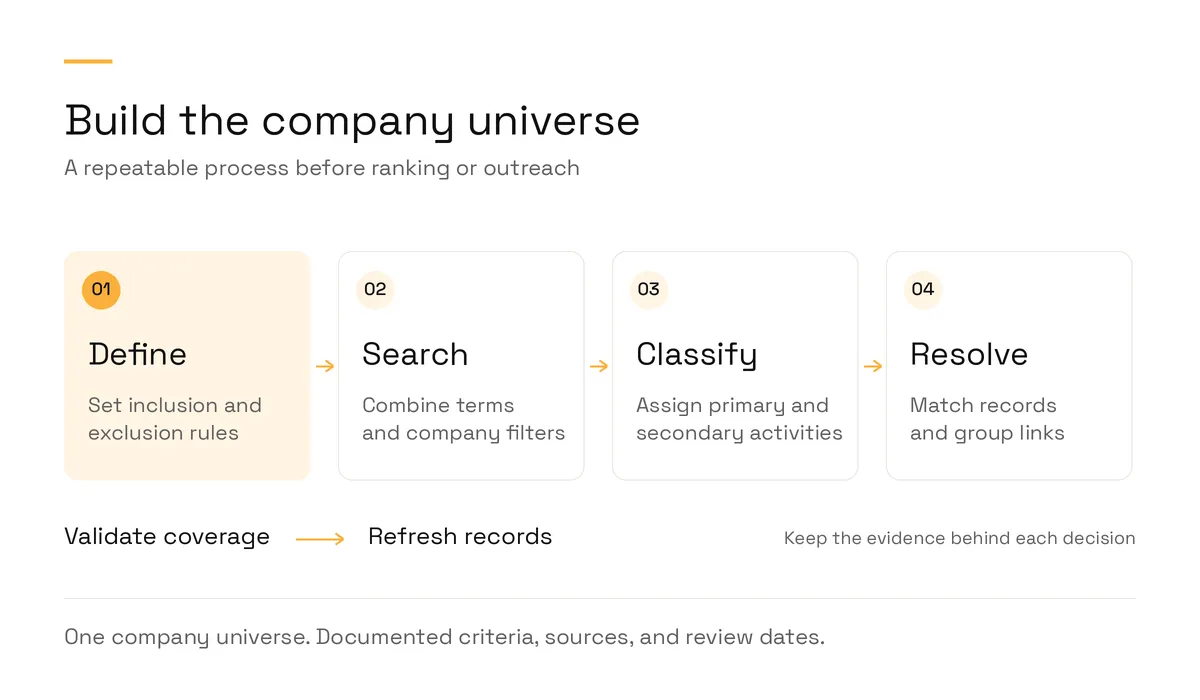
Illustration: Veridion
Start by defining which companies belong in your market.
1. Define the Market Boundary From the Investment Thesis
Before searching, define which businesses fit your investment thesis.
“Industrial services” is too broad on its own: it can include machinery repair, construction, and other activities. Specify the services, customers, and business models your thesis covers.
Start by turning the thesis into criteria your team can apply consistently, as shown below:
Criterion | Example for an industrial services thesis |
|---|---|
Customer type | Industrial facilities, not homeowners or retail chains |
Use case | Recurring inspection, testing, and repair of fire protection systems |
Business model | Service contracts, not one-off installation projects |
Geography | The U.S. Midwest |
Size range | 20 to 150 employees |
Next, turn each criterion into a written rule. State what qualifies and what does not, so two analysts reviewing the same company can reach a consistent decision.
Consider common edge cases like:
- Overlapping activities: a company offers fire protection and HVAC services. Does fire protection represent a core business line or a minor offering?
- Group membership: is the regional business a branch of the same company or a separate subsidiary? Decide how each should appear in the map.
- Borderline sizes: a company with 160 employees falls just outside your range. Consider a watchlist rather than removing it outright.
Keep an exclusion log with the reason and date for each borderline decision. This prevents the team from repeatedly debating the same companies.
A market map establishes which companies fit the market definition. A target list narrows that universe for further evaluation.
For example, excluding companies without published revenue can remove relevant founder-owned businesses before your team has assessed them.
2. Turn Thesis Criteria Into Search Queries
Once your boundaries are clear, translate every inclusion rule into searchable terms.
A single keyword search can miss relevant businesses. Search for “fire protection,” and you may overlook companies describing themselves as “life safety,” “sprinkler testing,” or “suppression services.”
Searching a single industry code can also miss companies classified under a different primary activity.
So combine several discovery methods:
- Customer terminology: search for the terms a plant manager would use to find a service.
- Product and service descriptions: search for specific offerings, such as annual sprinkler inspections or fire pump testing.
- Lookalike searches: find companies resembling known portfolio businesses and previous targets.
- Firmographic filters: narrow results by geography, headcount, and ownership.
For the fire protection thesis, combine terms such as “fire protection,” “life safety,” “sprinkler inspection,” and “fire pump testing” with the defined Midwest geography and the 20-to-150-employee range. Review the descriptions to distinguish recurring industrial services from residential work or installation-only businesses.
Record each query, its purpose, filters, source, execution date, and result count. Also note which query discovered each company. When a known business is missing, these records help you identify the search gap.
Sutton Place Strategies’ FY 2024 Origination Benchmark Report analyzed 176 qualifying PE clients. Median coverage was 17.6%, measured as the share of completed, advisor-led PE deals in each firm’s relevant industries and size ranges that the firm had reviewed.
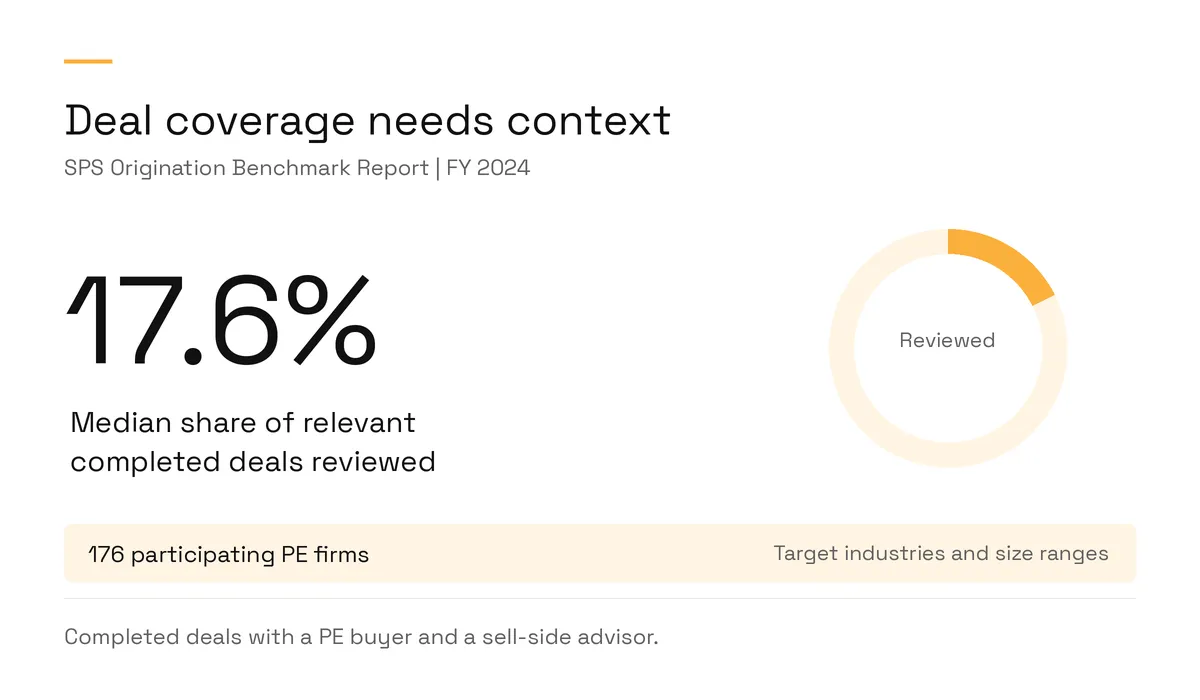
Illustration: Veridion / Data: SPS by With Intelligence
Results also differ by strategy: sector-focused, middle-market firms reported median coverage of 32.2%, compared with 26.2% for quasi-generalist, middle-market firms.
Evaluate deal coverage against your investment strategy. If you rely mainly on inbound introductions and banker presentations, supplement those channels with searches for companies that fit your thesis.
Veridion’s Private Equity solution helps teams identify companies that match their investment criteria.
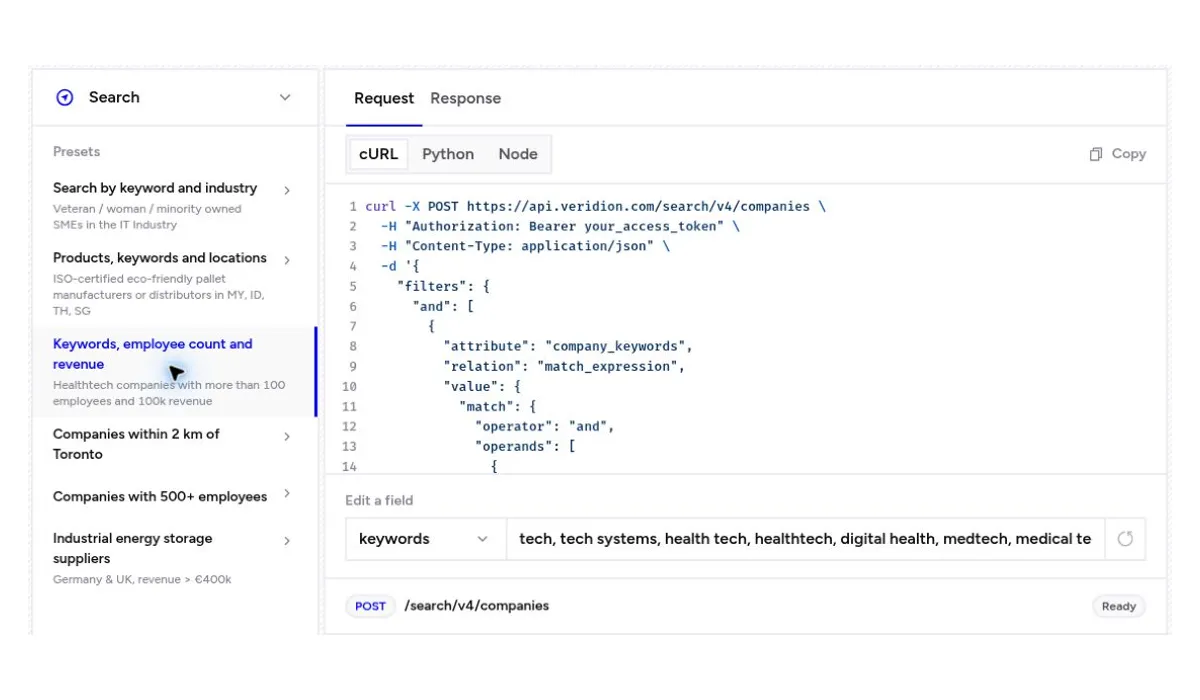
Veridion’s Search API combines keyword and industry criteria with company filters in one query. For keyword matches, returned text snippets show the company description that triggered the match, giving analysts evidence to review before including the business.
A global management consultancy used Veridion’s company knowledge graph to obtain market data for individual client engagements.
Standard research datasets followed the vendor’s scope and update schedule. The consultancy needed datasets tailored to each brief and delivered within the project timeline.
For each engagement, it specified the geography, industry, and required attributes. These could include industry codes, Veridion business tags, location types, products and services, and technologies in use. Veridion then delivered a dataset built to that specification.
PE teams can use the same approach to define a company universe around an investment thesis.
3. Classify Companies With Multiple Activity Labels
Industry classifications are useful starting points, but they may be too broad for a focused investment thesis.
The U.S. Census Bureau classifies each establishment by its primary activity for statistical purposes. However, a company operating across several business lines may compete in markets that its primary classification does not fully capture.
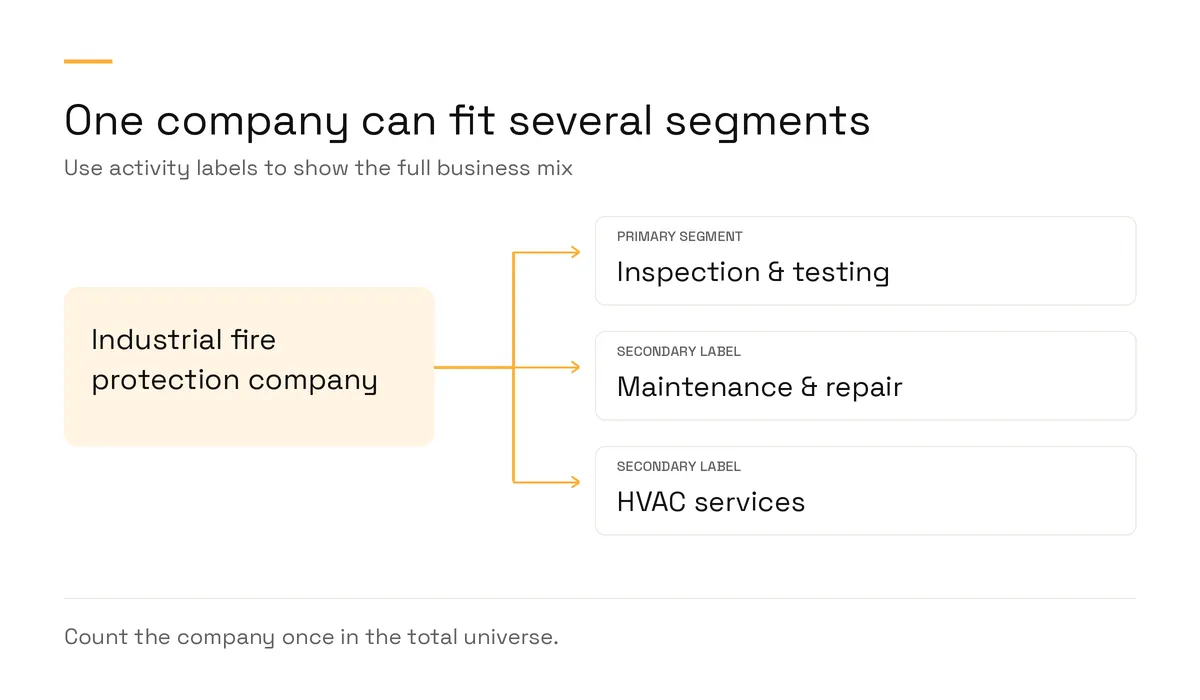
Illustration: Veridion
In “Scope, Scale, and Concentration: The 21st-Century Firm,” published in The Journal of Finance, Gerard Hoberg and Gordon Phillips use doc2vec to analyze business descriptions in companies’ 10-K filings. Their method captures activities that conventional business-segment data may overlook.
For the industrial fire protection thesis, classify companies by their service activities. The following illustrative segments distinguish core services from mixed or adjacent businesses:
Market segment | Business activity |
|---|---|
Inspection and testing | Recurring inspections and testing of fire protection systems |
Maintenance and repair | Ongoing servicing and repair of fire protection systems |
Mixed fire protection and HVAC | Both fire protection and HVAC services; verify the fire protection business fits the thesis |
Installation-focused businesses | Mainly one-off installation projects; exclude if recurring service is not a core offering |
Assign one primary segment and any relevant secondary labels. A company can appear in several segment views, but count it only once in the total company universe. Keep installation-focused businesses outside the core map unless they meet the recurring-service rule. This helps you:
- Find relevant businesses classified under a different primary industry.
- Separate pure-play companies from businesses with mixed activities.
- Group companies by what they do rather than by one administrative classification.
- Identify adjacent markets that may warrant further research.
You can also analyze annual reports, product descriptions, and company websites to validate these labels and uncover market overlaps that standard classifications may miss.
Classification rules also vary by purpose.
For example, the Small Business Administration (SBA) allows businesses to identify multiple NAICS codes for their products and services. For federal statistical purposes, each establishment is assigned one NAICS code based on its primary activity. A company with several establishments can therefore have different codes across its locations. Commercial databases may use their own methods, too.
Veridion’s company profiles support classifications including NAICS 2022, NACE Rev. 2, UK SIC 2007, and ISIC Rev. 4, alongside proprietary business categories and activity descriptors.
The response fields documentation lists the standard classifications. The industry documentation explains Veridion’s proprietary industries and business categories.
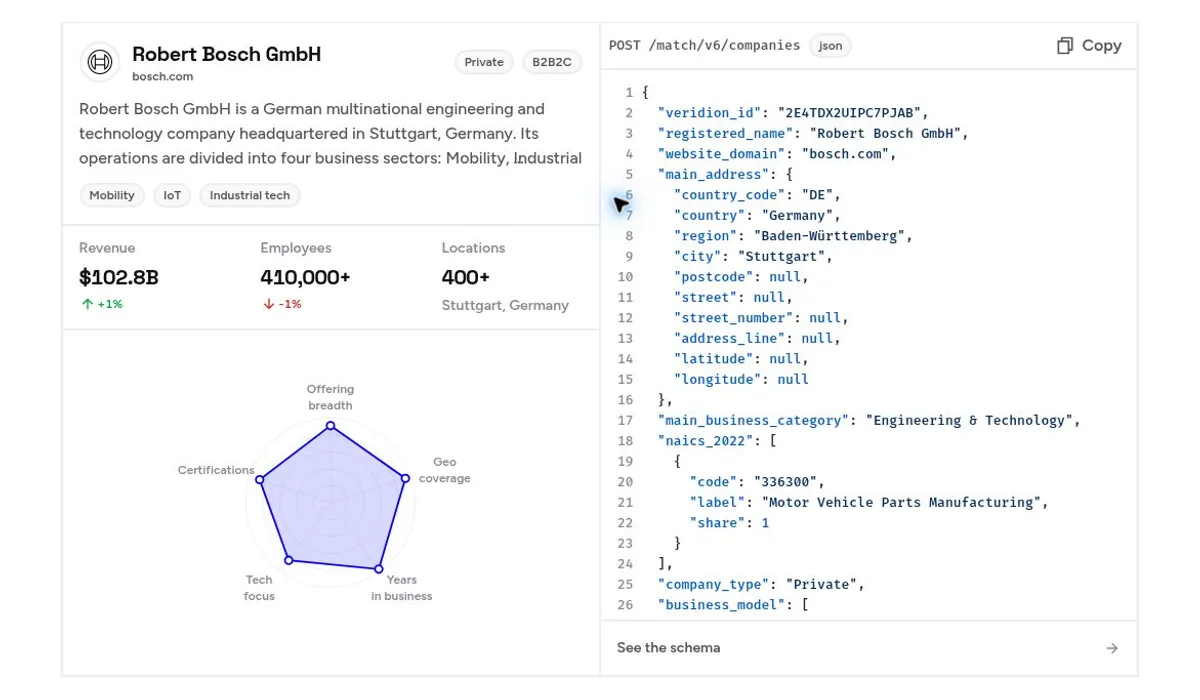
If you need to translate between taxonomies, our industry code mapping guide can also help.
4. Deduplicate the Universe Into One Record per Company
Combining results from several sources can produce multiple records for the same company.
In an illustrative fire protection search, three sources might return 400, 300, and 250 records. The combined list contains 950 records, but fewer unique companies if the sources overlap.
Counting those records separately inflates the company count.
Check four common issues when combining company records:
- Name variations: hypothetical entries such as “Midwest Fire & Safety Inc.,” “MW Fire Safety,” and “Midwest Fire” may refer to one company. Check identifiers before combining them.
- Parent and subsidiary confusion: check whether records describe the same operating company or separate companies within one group. Preserve distinct subsidiaries and record their ownership links.
- Multiple locations: several branches belong to one operating company.
- Rebrands and acquisitions: historical names can create duplicate records, but an acquired business may remain a separate operating company. Verify its identity before merging.
Entity resolution identifies records that refer to the same business so they can be reconciled.
Veridion’s entity resolution connects matching records to company profiles, provides confidence scores, and exposes uncertain matches for review. Analysts can then investigate ambiguous cases rather than automatically merging every similar record.
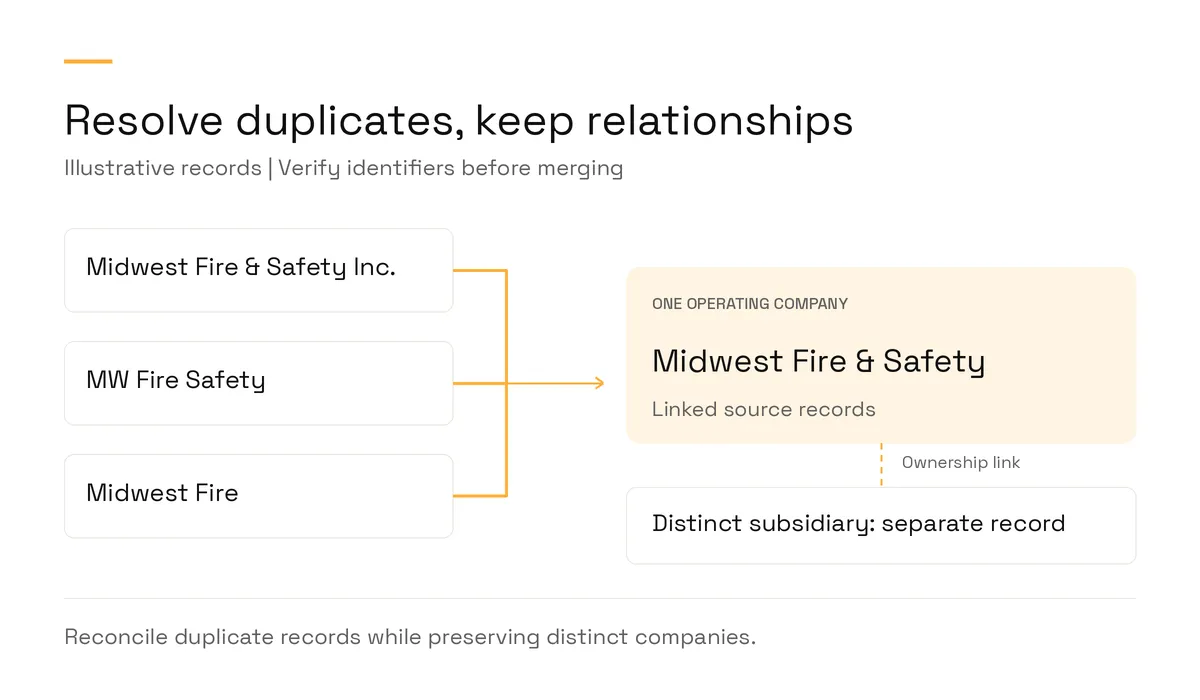
Illustration: Veridion
Decide whether the map counts operating companies, legal entities, or corporate groups.
These categories produce different totals. Eurostat defines an enterprise as an organizational unit with a degree of decision-making autonomy that may consist of one or more legal units.
For most PE market maps, counting operating companies while recording their parent groups provides a useful starting point. Whatever your approach, state the counting unit at the top of the map so readers can interpret the totals.
How to Check That a Market Map Is Complete
Assess coverage by testing for missing companies and poorly represented segments. These checks can reveal omissions, irrelevant companies, and inconsistencies, but they do not prove that every relevant business has been found. Document unresolved gaps and the date of the assessment.
To understand the completeness of your map, start with five checks:
Check | What it reveals | What to do if it fails |
|---|---|---|
Known-company coverage | Whether expected businesses are missing | Investigate gaps and expand relevant searches |
Independent business counts | Whether the market’s scale is plausible | Recheck geography, size, industry, and entity definitions |
Internal database overlap | Which companies are already known versus newly discovered | Reconcile records and investigate new businesses |
Sample review | Whether included companies fit the thesis | Correct false positives and refine classification rules |
Segment coverage | Whether certain regions, sizes, or activities are underrepresented | Run targeted searches and document remaining gaps |
Use official statistics and industry publications as reference points, but check their publication lags and definitions before comparing totals.
The U.S. Census Bureau’s Statistics of U.S. Businesses provides firm and establishment counts by geography, industry, and enterprise size for businesses with paid employees. Check whether your map uses the same population and counting unit before comparing totals. In Europe, Eurostat structural business statistics (SBS) cover enterprises by economic activity and size.
Eurostat’s final structural business statistics counted around 34.0 million enterprises in the EU business economy in 2024. Large enterprises, defined here as those with at least 250 people employed, accounted for only 0.2%. The distribution shows why a map built around highly visible businesses may miss much of the market’s long tail.
Document how the map was built. Keep the original thesis, inclusion and exclusion rules, queries, source records, deduplication decisions, validation results, and the date of the latest review.
This gives your investment committee a defensible explanation of how the universe was constructed.
Veridion’s data methodology describes the source trail and confidence score attached to each attribute, alongside the date it was last harvested.
Use this metadata to review company records and document why each business was included.
How to Keep a Private Equity Market Map Current
A market map needs updating as companies open, close, change ownership, or expand into new activities.
The UK’s Office for National Statistics reported 317,000 business births and 280,000 business deaths in 2024, corresponding to birth and death rates of 11.1% and 9.8%. Mergers, acquisitions, and restructurings create additional changes that registration figures may not even capture.
Your refresh process should therefore track meaningful business changes, not simply new registrations.
Watch for developments like:
- New companies entering the market.
- Existing companies closing or becoming inactive.
- Ownership changes, including acquisitions of founder-owned businesses.
- Companies moving between segments as their activities change.
Set a refresh schedule based on your sourcing activity. Monthly reviews can suit an active search, while quarterly reviews may be enough for a thesis you are not currently pursuing. Schedule the reviews in advance.
To compare versions, rerun saved searches and label companies as added, removed, or changed. For changed records, specify which attributes changed, such as headcount, ownership, or business activity.
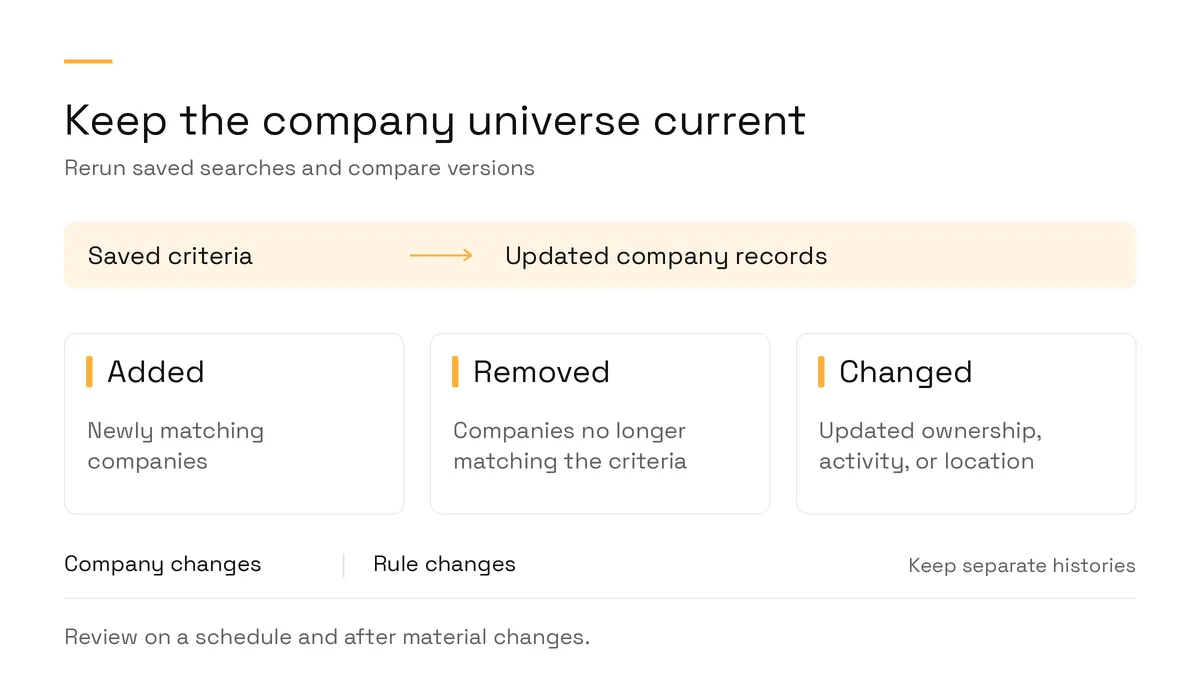
Illustration: Veridion
Record the evidence and review date for each addition, removal, or changed attribute.
Keep a change log that separates revisions to your classification rules from changes in the companies themselves. Otherwise, you cannot tell whether the market changed or your methodology did.
Review the thesis when changes affect the market definition itself, such as a new service category or a shift in customer demand. Routine changes to individual company records belong in the change log.
Veridion’s Private Equity solution helps teams find relevant companies and update their market maps. Veridion continuously refreshes core company profiles and updates volatile signals daily. Your team can review those updates on its own schedule, checking changes in ownership, location, and business activity against the map’s inclusion rules.
Flexible data delivery lets teams bring updated company data into their existing workflows.
For the next stage, our bottom-up market sizing guide explains how to use the company universe to estimate market size.
Conclusion
A private equity market map should show which companies fit your thesis, why they were included, and when their records were last reviewed.
Start with your current thesis and write explicit inclusion and exclusion rules. Use those rules to check your existing company list for missing businesses, duplicate records, and companies that no longer fit.
Articles
Discuss how these trends affect your organization.
Our analysts are available for a short call. Bring a specific question and we will ground it in the data.
Insights
Keep reading
More analysis, research, and outcomes grounded in live company intelligence.
How Veridion’s Entity Resolution Engine Achieves a +99% Matching Rate for B2B Databases
Struggling with B2B data deduplication? Veridion's entity resolution software boasts a +99% matching rate, transforming your databases.
Sizing the Opportunity: How Bottom-Up Company Data Sharpens TAM and Market Sizing
Struggling with inaccurate market sizing? Learn how bottom-up company data reveals crucial market signals for strategic planning.
Industry Code Mapping: How to Reconcile NAICS, SIC, NACE, and Internal Taxonomies
Industry code mapping reconciles NAICS, SIC, NACE and internal taxonomies through a master standard, validated crosswalks and one company identity.