Insights / Articles
Firmographic Data vs Technographic Data vs Intent Data: What Each One Actually Tells You
Looking into firmographic vs technographic vs intent data? This guide will explain what each data type tells you and when to use it for B2B targeting.

- Firmographic data tells you who a company is, technographic data tells you how it operates, and intent data tells you when it buys.
- Each type moves at its own pace, so each needs its own refresh cadence.
- Combined, the three turn a broad market into a short, well-timed account list.
Two companies can look identical on paper. One might be ready to buy today, while the other might ignore you for a year.
Business-to-business (B2B) teams pull company data to tell those two apart. Three data types do the heavy lifting: firmographic, technographic, and intent data.
Each one tells you something different, and each one misses something too. Here is what each type shows, where they’re lacking, and how they work together to maximize benefit.
Firmographic Data: The “Who”
Firmographic data describes who a company is. It covers industry, size, revenue, location, and ownership. You can read it as demographics for a business.
Firmographic attributes show whether a company fits your target market. You can apply this filter before looking at intent or technology use. Most targeting starts here, since it is affordable and fast.
The speed comes from filtering. Users set filters like industry, size, or location. A business data platform then returns a matching list instantly.
You can also see how many companies fit your market within minutes. The right filter turns a list of millions into a list of thousands.
Every revenue or data team knows these attributes by heart. “Industry” places a company inside a market, while “headcount” and “revenue” capture its scale. “Location” and “ownership” together sketch its structure.
“Ownership” is worth a closer look here. A business owned by a larger parent usually takes longer to decide, and more people weigh in.
An independent company, by contrast, can move faster. “Ownership” tells you who holds the budget and who signs off.
Picture a global subsidiary that needs approval from a parent overseas. An independent firm facing the same deal can decide in one room.
Here's what those core firmographic fields look like together:
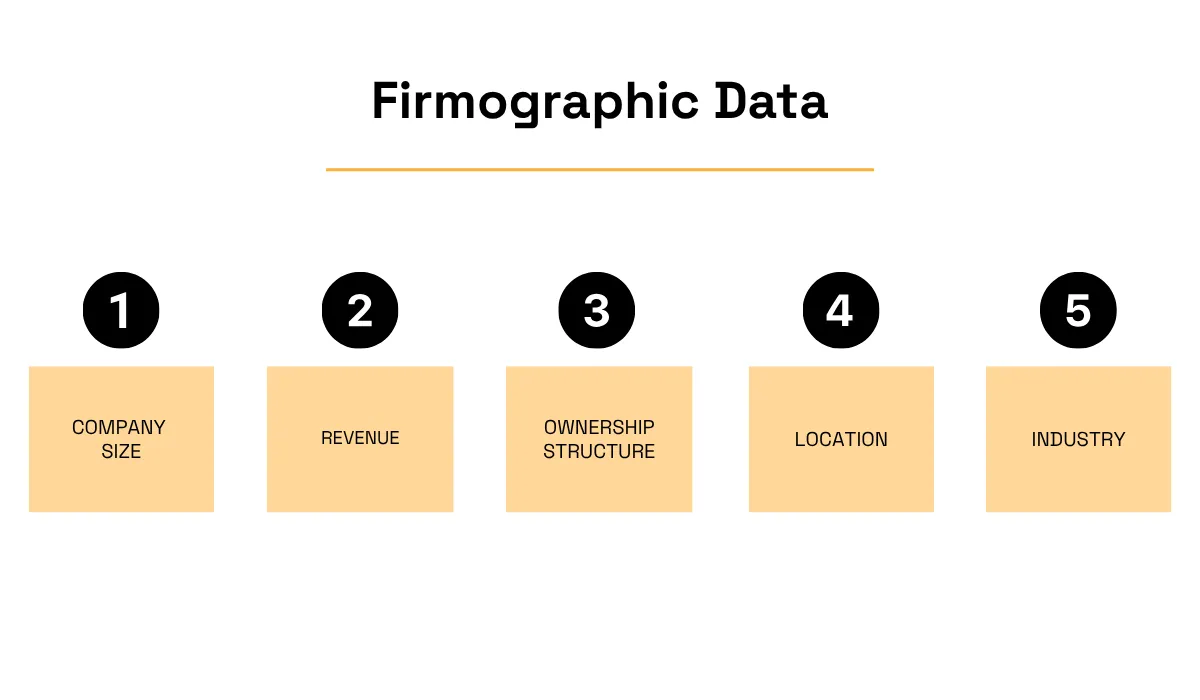
Illustration: Veridion
Another strength of firmographic data is stability. The fields rarely shift from week to week. You can segment a market by size or headcount and trust that grouping for months.
Companies merge, relocate, or rebrand only now and then, so a quarterly refresh keeps most fields accurate. A small yearly change in a company's headcount won't undo the segmentation you set up last quarter.
Firmographic fields are also the easiest to source. Public registries, filings, and company sites confirm most of them. A clean base here makes every later step easier to trust.
Your reporting leans on these fields, too. Territory maps, quotas, and dashboards all use them. A stable base keeps those numbers consistent quarter over quarter.
Change does arrive, though, and it can arrive fast. An acquisition folds a target into a parent overnight. Its owner, name, and headcount all shift in a single announcement.
Firmographic data misses how a company actually runs. Two firms in the same industry and size band can operate on very different technologies. One might update its cloud stack weekly; the other might patch aging software only when broken.
Firmographic fields cannot separate those two companies. For that, you need the next data type.
Technographic Data: The “How”
Technographic data picks up where firmographics fall short. It maps a company’s real technology stack. You see the software and platforms a company runs every day.
The stack shows whether a company has the right environment for a given product. Take customer relationship management (CRM) software as an example. A firm with no CRM is a poor fit for a CRM add-on, no matter its size.
Not all stack data is gathered the same way, though. The method behind each record affects how much you can trust it. Some records come from real digital signals, like a company's own website or a live job posting.
Providers call this direct approach deterministic data. It reflects what a company is doing right now.
Other records rest on estimates instead. A model looks at patterns across similar companies and guesses which tools a firm probably uses. Modeled estimates cover companies where no direct signal exists, but they carry more error.
So how does deterministic collection work in practice? It reads what a company puts online. A tracking tag in the page source, for example, names a tool outright.
Where a record comes from matters most at scale. A single wrong guess is a minor error.
Thousands of wrong guesses, though, add up fast. A campaign aimed at firms without the tool can derail entirely. Verified website signals avoid that risk because they show what a company genuinely uses.
Reliability, then, determines whether technographic data is useful at all. A confident stack reading lets a sales rep open with precision. One shaky guess wastes the first line of every email.
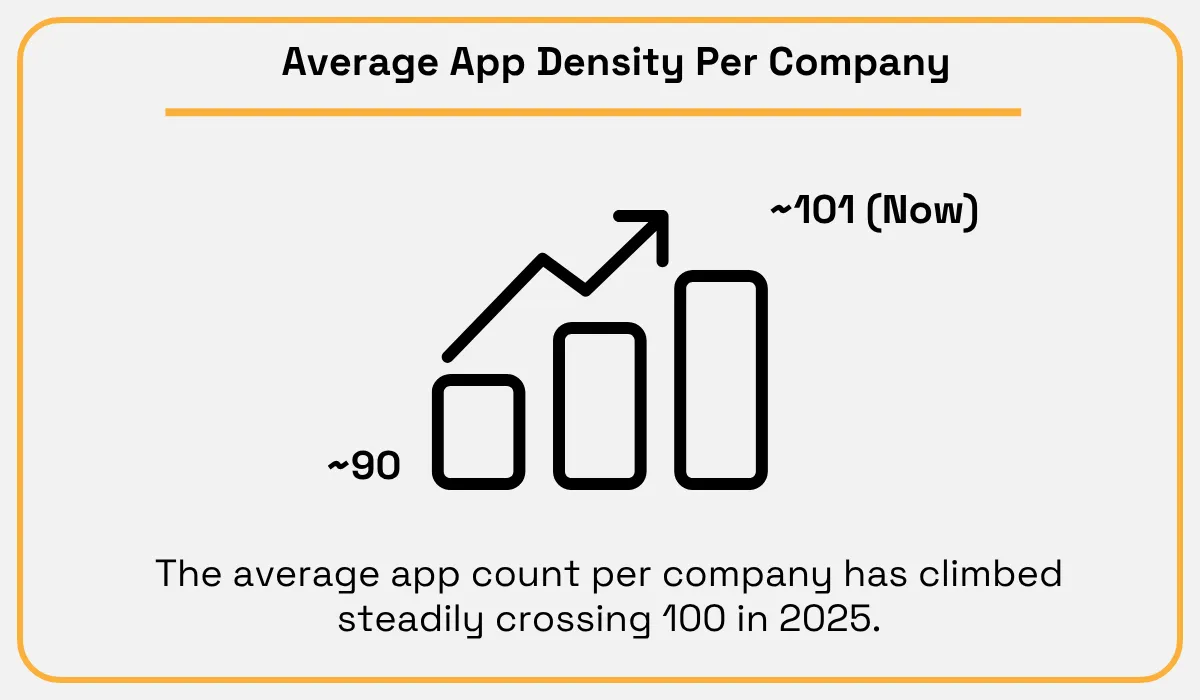
Modern companies run enormous stacks. Okta, an identity and access management provider, tracks this in its 2025 Businesses at Work report. The report puts the average at 101 apps per company, crossing 100 for the first time.
A stack of that size offers dozens of angles for outreach. Each tool a company owns gives a rep a hook for a pitch.A missing tool, on the other hand, opens whitespace the rep can offer to fill.
Reliable technographics power three specific plays:
Play | What it targets |
|---|---|
Displacement | A rival tool already runs inside the account, and the pitch leads with the pain that tool isn't solving. |
Integration selling | The company already runs a tool the product plugs into, so the pitch is fit rather than education. |
Gap analysis | No tool exists in the category at all, leaving clear whitespace and a cost to quantify. |
Beyond these plays, stack size itself says something. A modern stack signals a buyer ready for advanced products. A thin setup suggests the company is still buying the basics.
Technographic data also sorts a market by the tools inside it. A company can pull every business running a given cloud platform or CRM. Each group then hears a message tuned to its exact setup.
Here is an example case: A vendor sells an app built for one ecommerce platform. Stores using that platform reveal it in their site code.
A stack query can pull every store running the platform, and the reading stays current and exact. The vendor then skips every other platform and pitches only real users.
Keep freshness in mind here too. A tech stack changes more often than firmographic details like “headcount” or “funding stage”.
The core stack rarely shifts in a week, yet tools come and go across a year. A monthly or quarterly refresh keeps the picture current.
Even up-to-date data has a blind spot. It shows what a company uses right now. The record stays silent on whether a tool was just added or is on its way out.
The timing question needs its own data type. Intent data answers it.
Intent Data: The “When”
Intent data captures behavior. It flags a company that is evaluating a solution right now. Signals include research spikes, content downloads, and review site visits.
Buyers leave three kinds of signals, sorted by who owns them.
Signal type | What it is |
|---|---|
First-party | Behavior on your own site, like a demo request or pricing-page visit. Precise, and yours alone. |
Third-party | Research on outside sites, pooled across publishers into topic surges. Surfaces buyers before they reach you. |
Second-party | A trusted partner's first-party data, shared with you. Clean signal, wider reach. |
First-party signals come from channels you control. A demo request or a pricing page visit counts. You own that data, so it stays precise and hard for rivals to see.
Third-party signals come from outside your own channels. A provider pools reading activity across thousands of publisher sites. A spike in one company’s research on a topic is called a topic surge.
Surge data widens your view of the market. It surfaces buyers who have yet to touch your brand. You meet them while they are still shaping a shortlist.
Second-party intent falls between the two. A trusted partner shares its own first-party data with you. The reach grows while the signal stays fairly clean.
So why use more than one source? Each reflects a different part of the same journey. First-party signals show buyers already on your turf, while third-party shows the ones researching elsewhere.
No matter the source, one signal alone rarely tells the whole story. A single content download could mean idle curiosity. Several related visits across a week read as real intent.
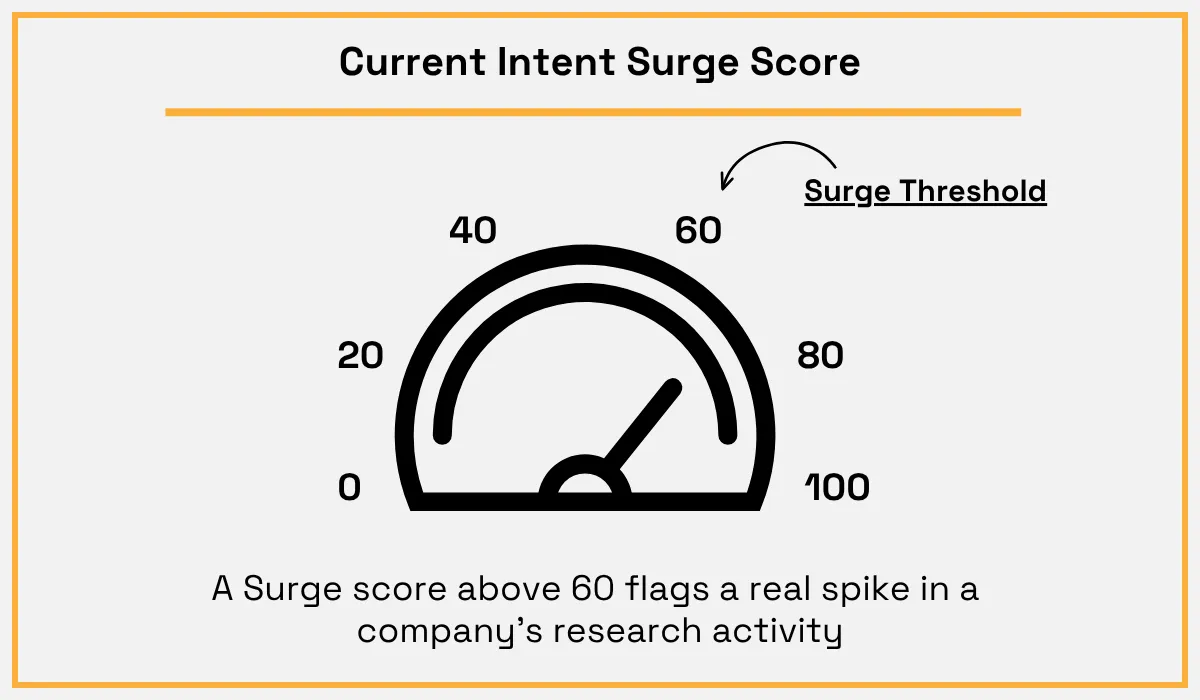
Intent signals also change quickly, so timing matters more here than with the other two types. Bombora, an intent data provider, handles that pace with a scoring model. Its Company Surge model flags an account as spiking once its score on a topic crosses 60.
The 60 mark is a meaningful cutoff. A score above it means research activity has jumped well past the company's own normal level.
What does a surge look like in practice? An account might spike on a topic this Monday, and a rep has that week to act. By the next report, the account may have fallen back to baseline.
A window that short rewards speed. Fast teams turn intent into pipeline while it is still warm. A signal parked in a spreadsheet for a week often goes cold.
The goal, then, is simple. Get the surge into a rep's hands the same day it appears.
Short windows also force teams to choose. The few accounts surging hardest each week get the attention. The rest wait for their own signal to arrive.
Intent works best as a prompt to act now. Firmographic and technographic data together have already proved the account is a fit. Intent just says when to move.
Remember that intent also decays faster than fit signals. A pricing-page visit can cool within a day. A broader topic surge holds value for a week or two before fading.
Speed cuts both ways, though. A company can surge on a topic and still be a poor fit for you. An eager buyer you cannot serve only clogs the pipeline.
The fix is to pair intent with fit data. A warm signal is fresh activity like a pricing-page visit or content download this week. That signal on a great-fit account is valuable.
The same signal on a poor-fit account is a trap. A poor fit stays a poor fit no matter how hot the signal runs.
Fit comes from firmographic and technographic data, as you saw earlier. The next section shows how all three combine into one working system.
Why All Three Layers Work Together
The three data types work best in sequence. Firmographic data marks the pool of companies worth addressing. Technographic data narrows down to those with the right setup, and intent picks who to chase this week.
Each type filters out a different kind of noise. Remove one, and irrelevant leads flood back in.
All three together fix the usual complaint about each type. Fit signals alone feel static, while intent alone feels noisy. Together, they cover each other’s weaknesses and produce a single ranked list.
Intent on its own floods you with weak signals. You chase firms that research your category yet miss your profile. The cleanest lists set a fit filter under every signal.
Fit without intent creates the opposite problem. You know exactly who to target, yet the right moment to call stays a mystery.
Good accounts get wasted this way. You call a perfect-fit firm the month after it chose a rival. The account was real, and the moment was gone.
Order matters as much as coverage. Firmographic and technographic checks come first and shrink the list to real-fit accounts. Intent then points you at today’s buyers.
A missing fit step fills the ranking with noise. Thousands of surging firms crowd in, and reps burn the week chasing accounts that go nowhere.
So what does the sequence look like in action? The process starts broad, narrows by setup, then ranks by timing.
For example: One team sells an analytics product that plugs into a cloud data platform. They build the base list with firmographics, filtering by industry and size. A tech stack query then keeps only the companies already on the platform.
Firmographics alone might leave fifty thousand mid-market firms. The filter cuts that down to eight thousand real-fit accounts.
Intent then ranks those eight thousand again. The week opens with two hundred target accounts. The list refreshes on Monday, and the order changes.
The result is a tight, high-fit list. Fresh intent ranks it each week by who is active now. Revenue teams then work from the top of the ranking first.
Notice that coverage without order still fails. Three raw datasets sitting side by side help no one. A good sequence turns them into a working queue.
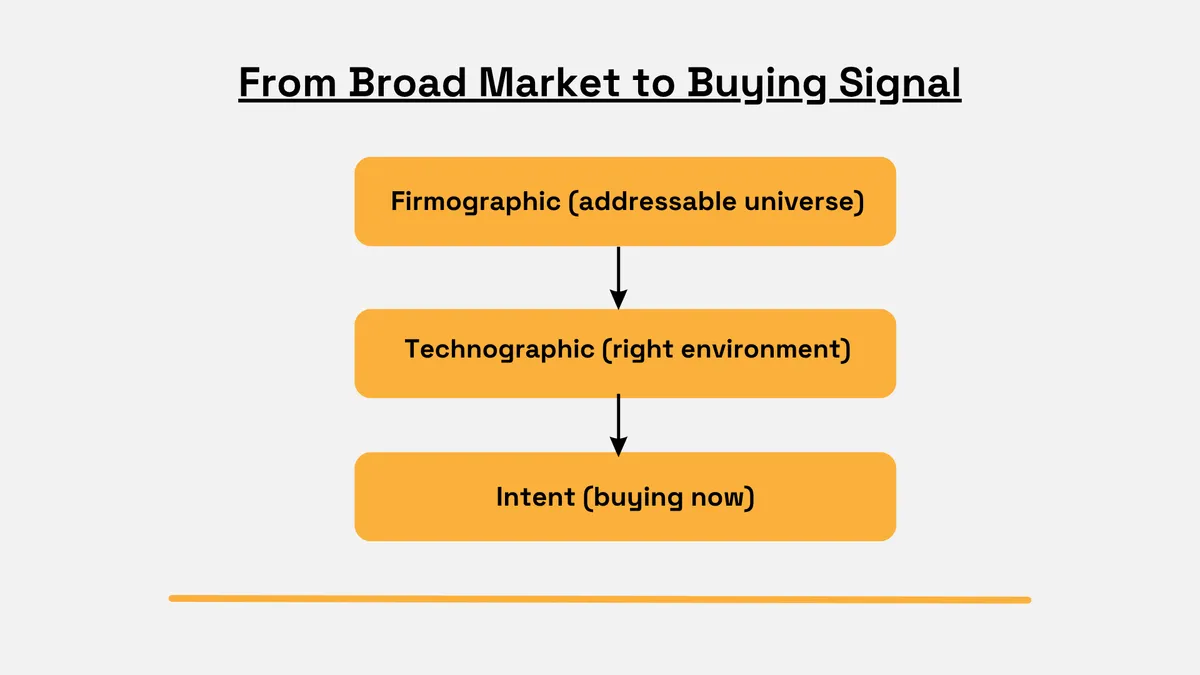
Illustration: Veridion
The ranking shifts every week as new signals rise and old ones fade. A good-fit account with no current intent waits its turn. It climbs again the moment fresh intent appears.
The sequence also keeps the process focused. Everyone works from one ranked list, refreshed on a schedule, and guesswork about who to call disappears.
The three data types also map onto different teams. Data engineering owns the firmographic and technographic base. Sales and marketing act on intent week to week.
The data’s home matters just as much as its owner. Intent usually ships from a dedicated provider, while the first two data types can share one source. The next section looks at what that shared source needs to cover.
Getting the “Who” and “How” From One Source
Firmographic and technographic data answer the “who” and the “how”. One continuously updated company profile can carry both data types at once. A single profile saves you from reconciling two disconnected datasets on every build.
Two separate vendors for those data types add a hidden cost called entity resolution. The term covers the work of matching records that describe the same company.
Say one provider lists a company as “Acme Inc”. The other lists “Acme Incorporated” at a new address, and the join between them breaks.
Record matching alone can eat hours a week. One vendor spells a firm's name one way, and the other spells it differently. Each mismatch has to be caught and fixed by hand.
The cleanup work never ends after the first pass, either. Both datasets change on their own schedules. Every refresh reopens the same matching problem.
Data engineering feels the cost the hardest. The team carries every join and conflict through each refresh cycle.
A single unified profile hands that time back. One record replaces two, and the matching work disappears. A provider can lift that weight by shipping both data types together.
Veridion is one such business data provider. It holds firmographic and technographic attributes in a single company record.
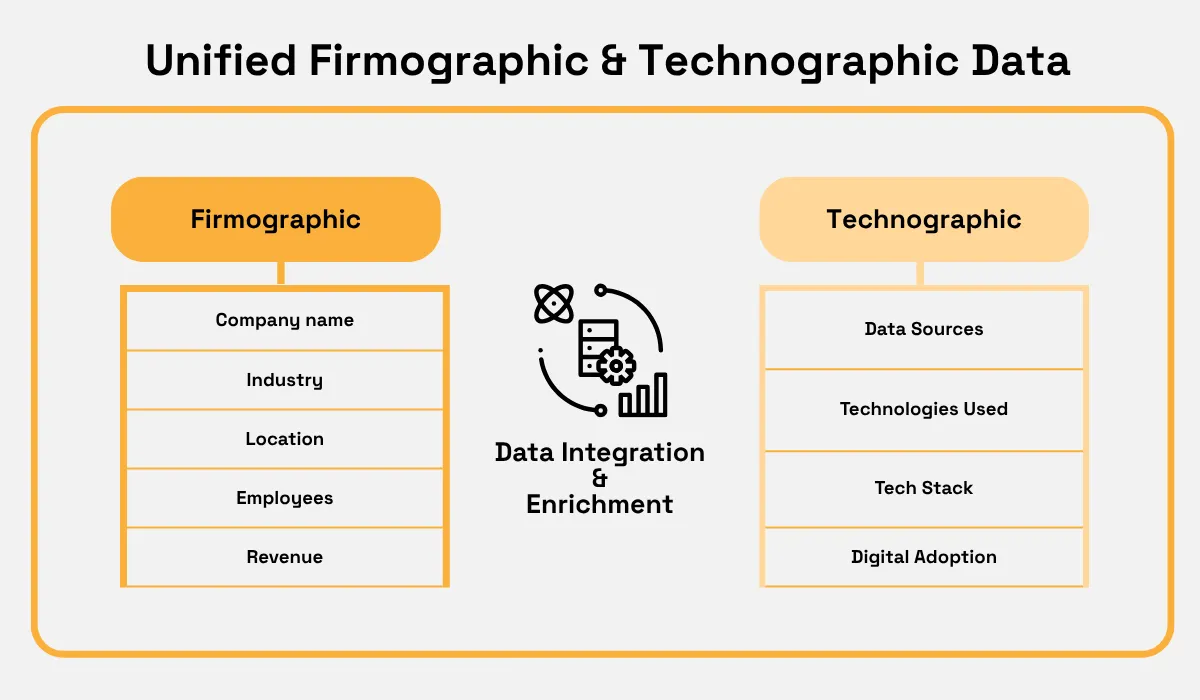
Illustration: Veridion
A unified record also travels well downstream. One application programming interface (API) call returns the “who” and “how” together, already joined. The data lands as a clean, single row per company.
Consistency like that protects everything built on top of the data. A company that shows up twice under two IDs can inflate a score or misroute a lead. One record per company keeps scoring and routing logic clean.
Enterprise lists feel the gain most, since matching pain grows across tens of thousands of companies. A single joined source removes that friction before it reaches the pipeline. The team can then spend its effort on timing and outreach.
Conclusion
Every first call should go to the right account. A strong pick fits your profile, runs a matching setup, and shows a live signal now.
A process built once beats pulling a fresh list every time. It turns a sales team from reactive to systematic.
Teams that act while the signal is still warm win the account.
Articles
Discuss how these trends affect your organization.
Our analysts are available for a short call. Bring a specific question and we will ground it in the data.
Insights
Keep reading
More analysis, research, and outcomes grounded in live company intelligence.
Feeding Clean B2B Firmographic Data into LLMs to Prevent AI Hallucinations in Market Intelligence
Tired of AI hallucinations in market intelligence? Learn how feeding clean B2B data into LLMs prevents inaccurate insights.
Data Attributes That Make Risk Models Smarter Than Basic Firmographics
Tired of basic firmographics? See how advanced data attributes help you identify emerging market risks and build smarter, more resilient risk models.
The Technographic Data Providers That Stand Out in Today’s B2B Market
Tired of sifting through endless lists? Find the top technographic data providers that truly impact your B2B strategy and cut through the noise.