Insights / Articles
How to Map Your Competitor's Customer Base Using Firmographic Data
Tired of guessing who your competitors' customers are? Uncover their client base with firmographic data providers and gain a strategic advantage.

- Public case studies show only a small view of a competitor's customers
- A live company database can surface accounts a competitor serves quietly
- Cross-referencing that list against a CRM reveals which accounts are contested and which are untouched
A competitor's public case studies and logo wall show only the happiest, most quotable customers. The rest of the customer base stays invisible to any sales team looking in from outside.
Unseen accounts are the ones a sales team never targets, and missed targets cost deals.
Four steps can turn public evidence into a full customer map. The work covers rebuilding the target profile, expanding to look-alikes, matching against the CRM, and outreach.
1. Define the Competitor's ICP Using Public Data
Every vendor leaks its ideal customer profile through public marketing. Case studies, logo walls, and press releases reveal who a company is built to serve. All of it feeds the first input for rebuilding a competitor's ideal customer profile (ICP).
You can pull the target list from a handful of standard sources. They are public and easy to gather:
- Case study pages
- Logo walls
- Review sites like G2 or TrustRadius
- Press releases
- Industry awards
- Partner announcements
Some tools do this automatically, pulling data from vendor websites at scale. Either way, the list is a starting point.
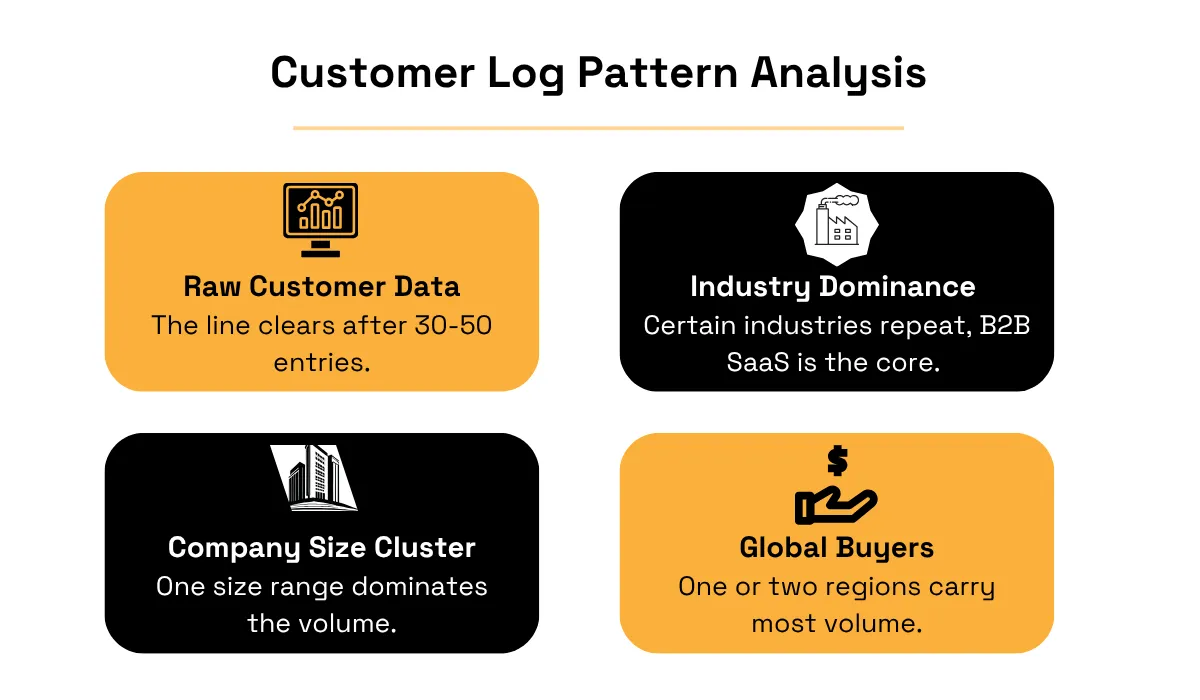
The next step is reading the list for patterns. For each named customer, note industry, size band, geography, and product or service type.
Source: Veridion
Around 30 to 50 entries is a practical starting point for spotting patterns. Certain industries repeat, and one size range dominates. One or two regions also carry most of the volume.
One example makes this clearer. A working sample of 40 named customers comes from an analytics vendor selling to mid-market clients. Their sources are case studies, the review-site profile, and press releases.
In the sample, 60 percent operate in business-to-business (B2B) software as a service (SaaS). Company size clusters between 200 and 1,000 employees. Geography leans 70 percent toward the United States and the United Kingdom. Buyer titles across the case studies repeat revenue operations, finance, and data engineering.
Not every competitor gives you that much to work with. Private-equity-backed vendors and small startups may show only a handful of case studies.
For those cases, three other sources help fill in the missing picture. Job postings, executive LinkedIn activity, and integration partner directories all count. The result will be less precise but still usable.
Even the fullest sample carries a built-in bias. Featured customers tend to be bigger, happier, and more talkative than most others. Mid-market clients and low-profile renewals rarely make the logo wall.
The competitor's marketing language clarifies the picture further. The homepage names certain industries as targets. Webinars and product pages lead with specific pain points.
All of that is a working guess about who a company sells to. Even so, the hypothesis usually matches the accounts a sales team chases the hardest. Public evidence naturally clusters around active pursuit rather than the full addressable market.
By the end of this step, you should have a firmographic sketch. It covers industries, size range, geographies, and product characteristics of the competitor's likely target.
Public logos alone can't confirm or expand that picture. They show a curated view, not the full customer base. A live company database completes it, matching the working profile against real, current firmographic data.
2. Search for Companies That Match That Profile
The firmographic data only becomes useful when checked against a live company database. A company database can show the full list of matching companies.
The search covers the entire market, not just the 20 or 40 named customers. Filters narrow it down by industry, size, location, and product type.
The result is a list of similar companies, often several thousand of them. A competitor with the same target market would go after these accounts. Public visibility on a logo wall does not decide which ones.
The mismatch shows up in raw numbers. A vendor might list 500 case studies but have 40,000 similar companies to sell to. The logos that do appear also skew toward customers happy to be named, leaving the rest hidden.
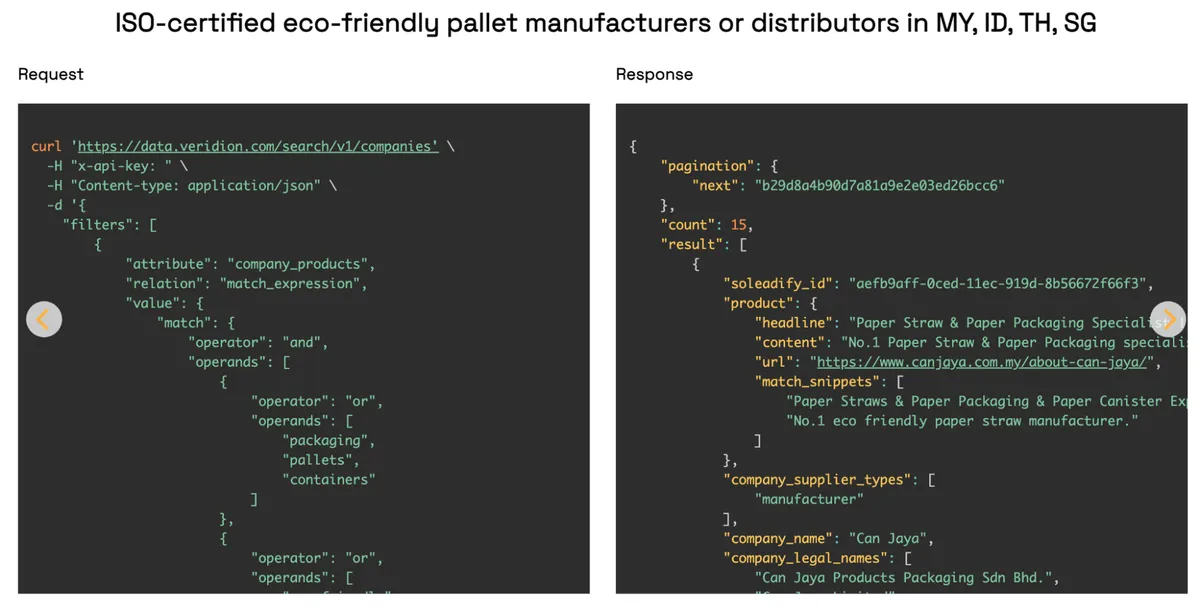
A live business data provider like Veridion delivers this in practice. Its Search API lets users search the live business landscape using firmographic filters. The product documentation covers the full filter list.
Source: Veridion
A typical search uses four filters. The first is industry, using a standard code like 5182 for data processing and hosting.
The second is company size, say 500 to 5,000 employees. The third is product keywords, like "observability" or "log analytics." The fourth is location, like North America or Western Europe.
Filters can combine in different ways, using "and" or "or" logic. The data refreshes constantly, so results stay current.
The search returns a live count of matching companies plus a downloadable list. The count itself is the first check on whether the filters are set correctly.
A narrow, strict search might return a few hundred companies, suggesting a small target market. A looser search might return tens of thousands, hinting at a much bigger market.
Technographic filters add another layer where they're available. A technographic signal detects whether a company runs a specific piece of software. Detection methods include public web scanning, job posting analysis, and integration footprints.
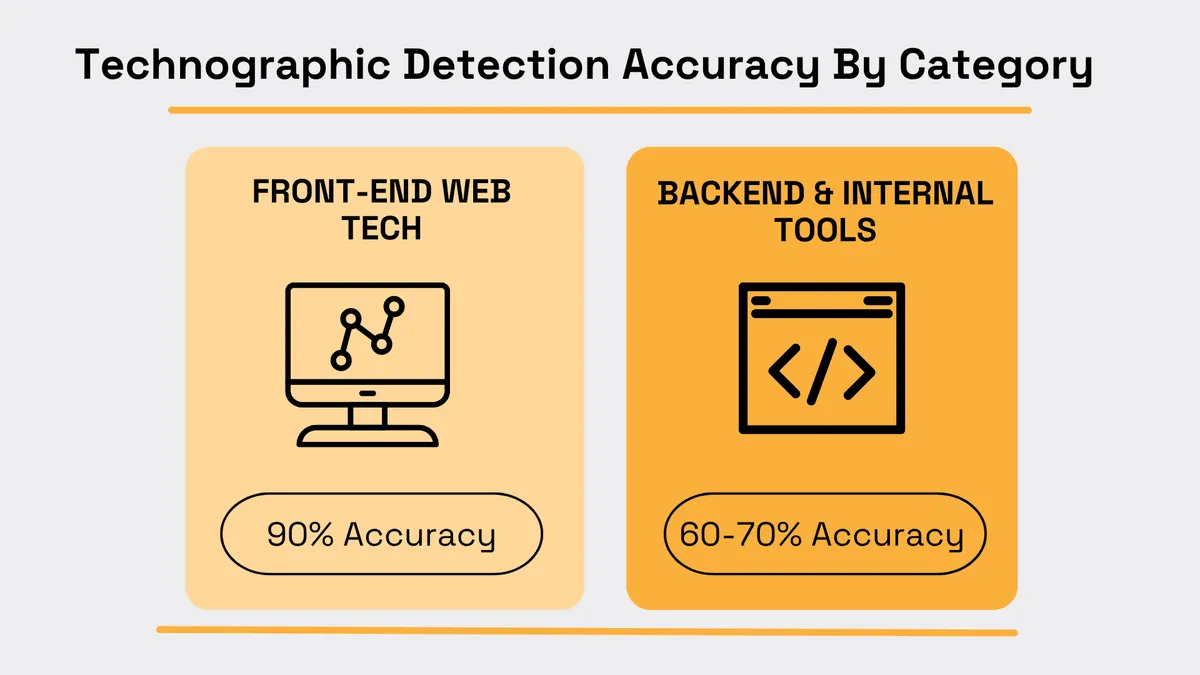
Illustration: Veridion / Data: PredictLeads
Each method produces different accuracy by category. Front-end web technologies reach around 90 percent accuracy. Backend systems and internal tools land closer to 60 to 70 percent.
A technographic match narrows the list to companies already using the competitor's tools. Accounts on that shortlist are more likely to buy, and intent signals build on it further.
Intent signals sharpen that shortlist even more. A company browsing the competitor's pricing page outranks one already using the product. G2 reviews add another layer. The best results come from combining these signals rather than relying on any single one.
Two mistakes can ruin this step. Filters set too wide return tens of thousands of accounts, most of them irrelevant. Filters set too narrow miss related companies the competitor may serve without saying so publicly.
The safer method starts narrow and widens step by step. You tighten the filters first, then loosen them gradually. The list eventually settles into a stable size.
What comes out is a candidate list, every company that could plausibly fit the target market. But the list is only raw material. It still needs a check against real accounts.
3. Compare Results Against Your Own Customer Database
A candidate list in a spreadsheet is not yet a targeting plan. It becomes one only after comparing it against the company's own customer relationship management (CRM) system.
The comparison needs two exports. The first is the candidate list. The second is the CRM's active account list with opportunity stage attached.
The match works best on company domain, since names carry variations across databases. An unclear match on "IBM" can collide with "IBM Consulting" or "IBM.com Ltd." Domain avoids that ambiguity.
Company name can be used instead when domains are missing, though it needs cleanup first. Domain matching handles most cases cleanly, but real CRMs still throw up tricky exceptions.
Parent-subsidiary structures cause most of them. A parent company might sit in the CRM at "group.com". The buying subsidiary might appear in the candidate list at "group-us.com". Mergers add another layer: two records might have collapsed into one, or one split into two.
Cases like these need a human sort. Clear matches get accepted right away. Uncertain ones get set aside for a data analyst or revenue operations owner to check by hand.
Duplicate removal is another step. The candidate list and the CRM might record one parent company and its branches as separate rows.
Related companies should be combined into one account before counting. Otherwise, the totals will look bigger than the real coverage.
The matched list splits into three groups. Each one calls for different treatment down the line:
- Existing customers
- Active opportunities
- Untouched accounts
The three-way split turns a raw list of companies into a strategic map. A fourth group comes from the same match.
Some CRM accounts won't appear in the candidate list at all. They sit outside the competitor's target market, and may point to a different segment worth studying. All four groups depend on how good the data is.
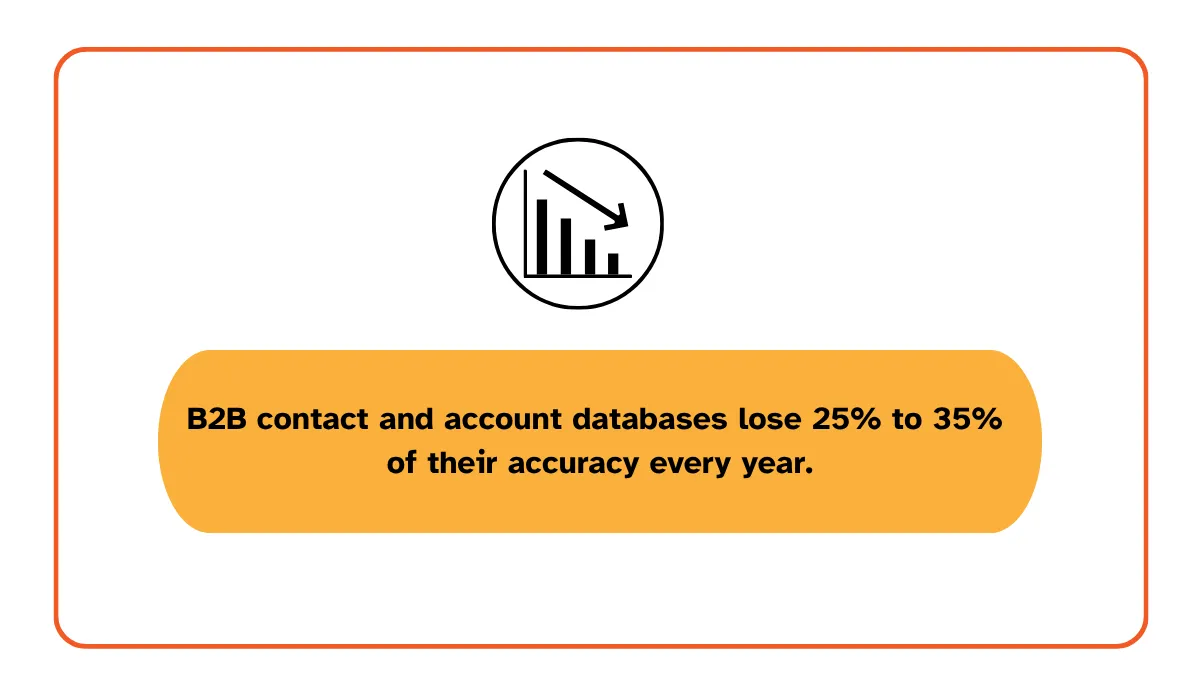
Illustration: Veridion / Data: Salesmotion
Data quality is where this can quietly fall apart. B2B contact and account data decays at roughly 25 to 35 percent per year. A company enrichment step on the CRM export helps cut down on outdated records before matching.
Clean data feeding the match makes the four groups ready to use. The next step turns them into a targeting plan.
4. Identify Contested Accounts and Whitespace Opportunities
Two groups matter most for revenue operations teams. Their treatment differs from the start.
Source: Veridion
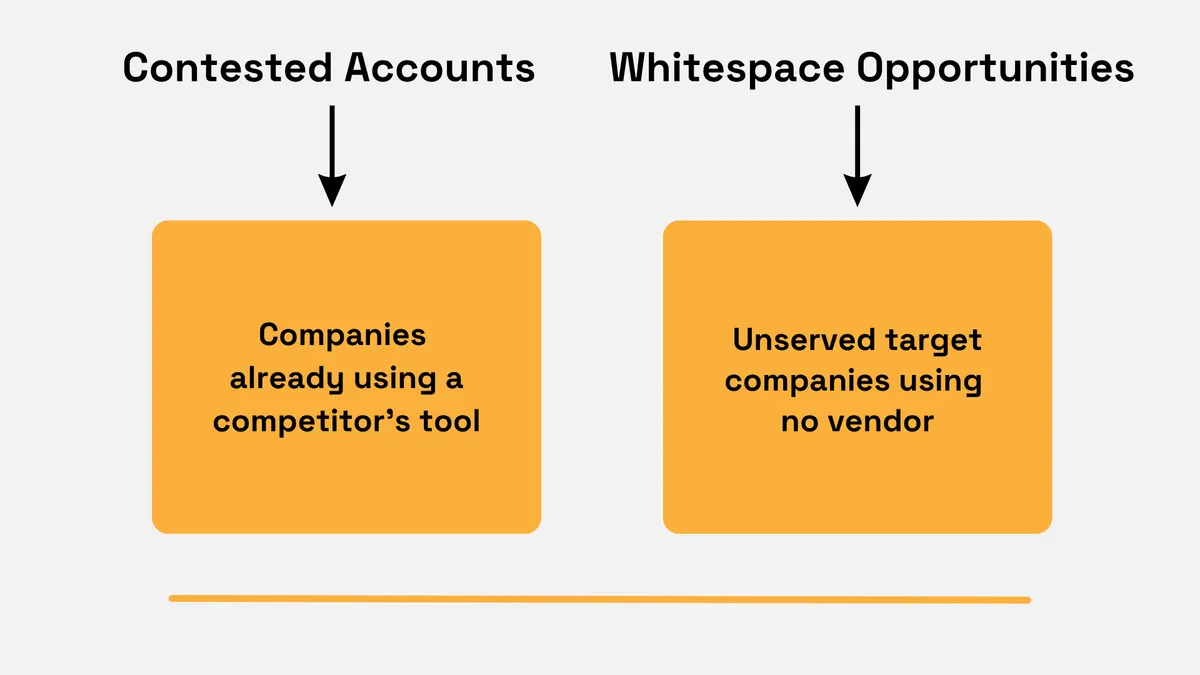
Contested accounts are companies where the competitor already has a foothold. Whitespace accounts fit the target profile but don't appear to be used by either company yet. Each calls for a different approach.
For contested accounts, the messaging should focus on why switching is worth it. Most of the work goes into handling objections around the competitor's known weak points.
Whitespace accounts need a different approach: education. Prospects in this group may not yet see the category as something they need. Sales outreach should first explain why the category matters, then why the product is the right choice.
One clarification about the term itself before moving on. "Whitespace" has two common meanings in sales and marketing, and mixing them up causes confusion.
The article uses "whitespace" to mean the market-level version. It covers a group of companies no vendor is currently serving.
A second meaning also exists in sales, called the account-level version. It refers to extra products or services sold to an existing customer.
The account-level version is mostly used when planning how to grow revenue from existing customers. Both definitions are legitimate and both fit real workflows. The market-level version is what this mapping exercise produces.
Sales and marketing treat the two groups differently now that the terms are clear. Sales focuses on accounts the competitor already has. A warm signal like that means less time is needed to explain the basics.
The marketing team focuses on whitespace accounts. Prospects in this group need a longer period of education before buying.
Outreach follows the same split. For accounts the competitor already has, emails open with a competitive angle. Weak spots in the competitor's product, recent changes, and switching costs all belong in the pitch.
For whitespace accounts, emails open with a category angle instead. Coverage includes the problem itself, why companies are solving it now, and proof that others have succeeded.
Prioritization works differently too. Contested accounts get ranked by deal size, the competitor's contract length, and unhappy-customer signals. Whitespace accounts get ranked by fit with the target profile, growth signals, and category maturity.
A quick example shows why the split matters. Numbers make the four groups feel more concrete.
Source: Veridion
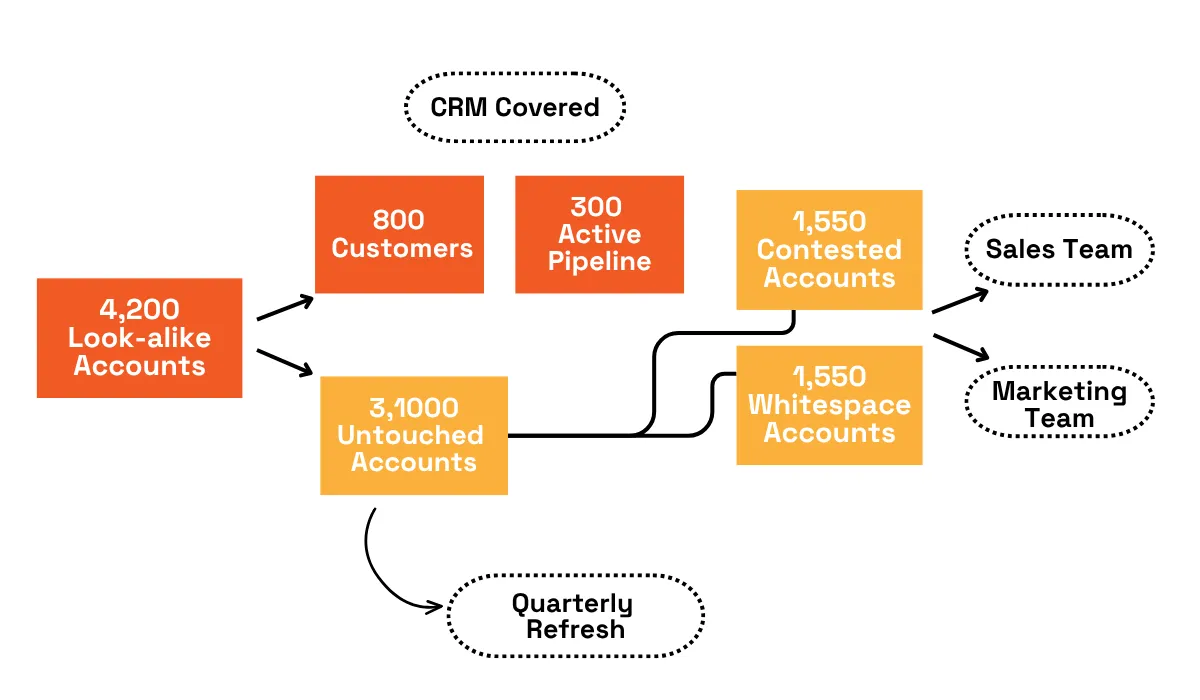
In one worked example, a competitor's target market maps to 4,200 look-alike companies. A CRM might already cover 800 of them as customers and 300 as active opportunities.
The math leaves 3,100 accounts untouched. Roughly half of them might show signs of already using the competitor's product. They belong in the "competitor already has" group.
The other half falls into whitespace, still waiting for a category-education approach. From there, the work splits cleanly.
Sales gets about 1,550 accounts to pursue with switching-focused outreach. The marketing team gets about 1,550 whitespace accounts to warm up with category content. Both teams work from the same map, updated on the same schedule.
The finished map feeds into standard sales and marketing systems. An account-based marketing (ABM) platform can treat the two groups as separate audiences. The CRM can tag the same accounts with a competitor field for reporting.
The map doesn't stay accurate for long, no matter which systems it feeds into. Both a competitor's customer base and a company's own accounts shift every quarter. A one-time count goes stale within months, so a quarterly refresh keeps the picture useful.
Conclusion
A competitor's customer base is easier to map than most teams assume.
The guesswork gives way to a repeatable process. Public logos offer a rough starting point, and firmographic queries expand that into a full match list.
What makes this exercise worth repeating is the movement over time. A single run shows where things stand today. A quarterly refresh reveals which accounts are slipping from whitespace into claimed territory.
Articles
Discuss how these trends affect your organization.
Our analysts are available for a short call. Bring a specific question and we will ground it in the data.
Insights
Keep reading
More analysis, research, and outcomes grounded in live company intelligence.
Want Better Competitive Insights? Here's a 5-Step Framework for SaaS Teams
Struggling to gain an edge? This 5-step framework provides competitive intelligence for SaaS teams to dominate the market.
Feeding Clean B2B Firmographic Data into LLMs to Prevent AI Hallucinations in Market Intelligence
Tired of AI hallucinations in market intelligence? Learn how feeding clean B2B data into LLMs prevents inaccurate insights.
Looking for a Firmographic Data Provider? Here Are the Top Options to Consider
Tired of sifting through endless lists for firmographic data providers? Find the top options that will streamline your sales.